Forge First Asset Management commentary for the month ended June 30, 2019.
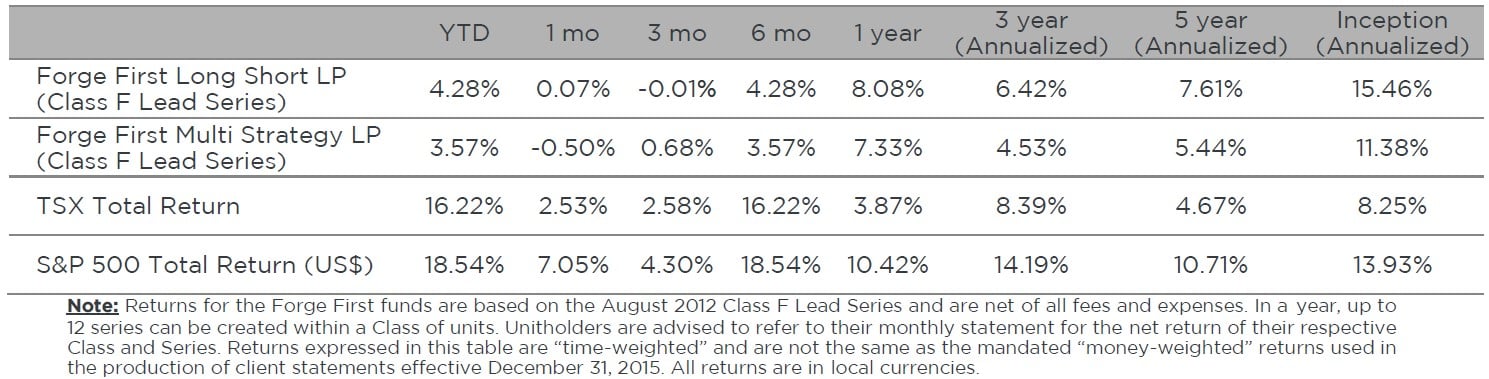
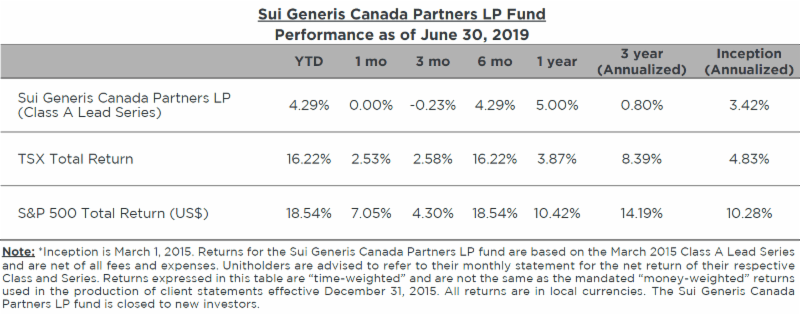
The Sui Generis Canada Partners LP fund was down 0.00% for the Class A Lead Series during June 2019, resulting in a year-to-date net return of 4.29% since inception (March 1, 2015) and cumulative net return of 15.67% (3.42% annualized).

Q2 hedge fund letters, conference, scoops etc
Forge First June 2019 Commentary
The wild ride in markets that began with Q4 of 2018 continued during H1 of 2019, but this year’s version has been a surprisingly good one. Starting with a powerful rally from January to April, followed by an air-pocket in May, stocks then soared to new all-time highs in late June. The big question now is whether stocks keep rising, run out of steam, or lose elevation during this year’s 2nd half.
Little doubt that the key to the first double digit 1st half total returns for each of stocks and bonds since 1997 was the 180 degree turn by America’s Federal Reserve. Hopeful that Chairman Powell could stem Q4 2018 losses, investors latched on to Powell’s early 2019 dovish tilt. However, with Powell’s credibility having become a tad tarnished, in light of trade wars & other concerning macro drivers, investors increasingly pushed back on his consistent pitch that the prolonged dip in U.S. inflation was transient. Consequently as can be seen in the graph on the below left, for the 3rd time during the past 20 years, traders moved the yield on 2 year U.S. government bonds well below the overnight Fed Funds rate, a sign that the markets are pushing Powell for rate cuts.
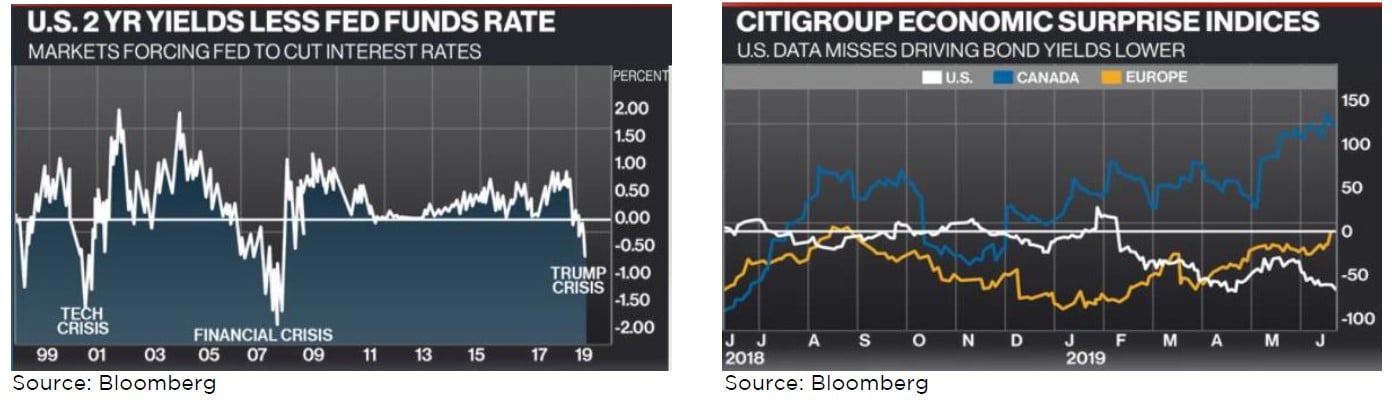
Then as implied by the -50 reading on the Citigroup Economic Surprise Index on the above right, there was logic to Powell’s comments in June that while the U.S. economy remained in expansion territory, that weakness in global demand and business fixed investment had skewed risks to the downside. Combined with a 0.3% decline in the FOMC’s median assumption for a neutral policy rate (on its ‘dot plots’) at its June meeting, markets threw the rising number of macro policy risks and falling corporate profit outlooks to the wind, and stocks to new highs.
Given the conservative positioning of our two funds, i.e., low net long exposures, June’s ripping stock was an unhelpful surprise. Consequently during the month of June, the Forge First Long Short LP CL F Lead Series gained 7 basis points, net of fees, such that its year to date net gain was +4.28% for H1 2019, interestingly, just less than half the fund’s 2018 net advance of +8.53%. Exiting June, the Long Short fund held gross and net exposures of 112% & 40%. Our 2nd fund, the Forge First Multi Strategy LP fell 0.50% net of fees for the CL F Lead Series, reducing its H1 2019 net gain to +3.57%. Repositioned towards the lower risk bound of its existing investment mandate during late 2018, Multi Strategy closed the month with gross exposure of 99% and net exposure of 32%.
Arguably June’s rally was attributable to the belief that a) the Fed’s easing will ensure the current slowdown is a soft patch vs the start of a recession, and b) the recalibration downwards of the neutral rate means those rate cuts are coming.
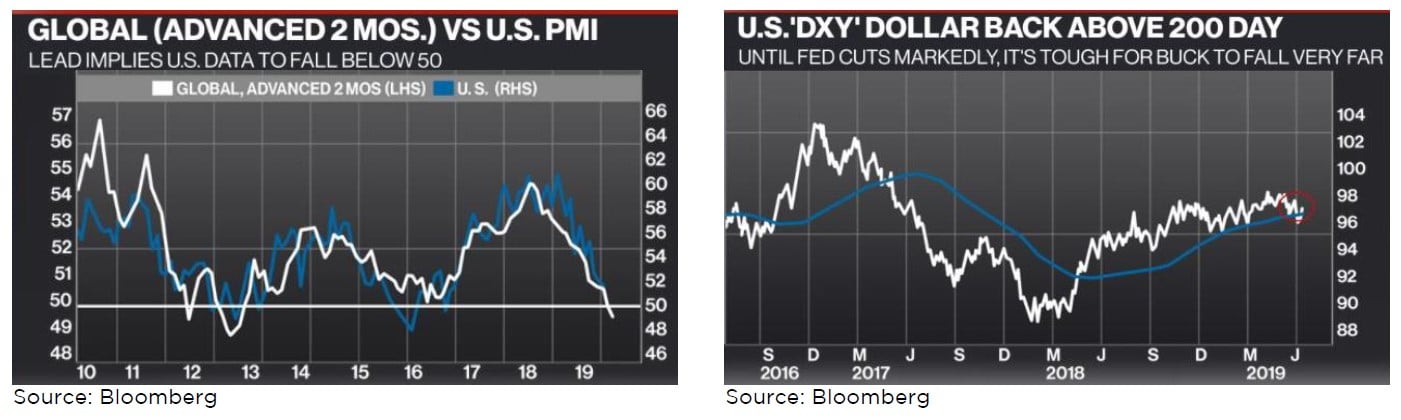
This latter point is important, as it explains why bonds and stocks have been moving higher together. Bulls call it ‘goldilocks’ but others say, ‘hey wait a minute’! It’s true it does appear that globalization combined with a technology-driven ceiling on the ability of corporations to hike prices has capped inflation. However, while the graph on the below left shows that U.S. industrial production has joined the rest of the world in trending towards recessionary territory, the consumer, roughly 70% of their economy (with 15% spent on healthcare & 55% on other spending), remains in decent shape (at least for now) with household debt down to 75% of GDP, a savings rate of 6.2%, and tight labour markets.
Consequently, it’s likely too early to assume the 100 basis points or 1% cut in U.S. overnight rates that the S&P at 2,978 & 2 year bond yields at 1.76% have priced in; though I will admit that Powell has almost promised markets a 0.25% cut in rates at the Fed’s end of July meeting.
Of course intertwined with what happens to U.S. interest rates is the outlook for the U.S. dollar. Bears are piling on, noting that the global reserve currency has traded below its 200 day moving average (see graph on above right) and that the Fed’s about to reduce its favourable carry. But if the USD is to fall, which currencies are going to rise? The Yen & Swiss Franc, a roughly 17% combined weight in the U.S. dollar or ‘DXY’ index, tend to advance versus the USD when markets are nervous, but the key currency, given its 58% weight, is the Euro.
While E.U. domestic demand and consumption are ‘okay’, trade and investment are lousy. Combined with a ‘take your pick’ of geopolitical risks, ECB Chair Draghi recently indicated that in the “absence of (further) improvements” in the data he will move to further ease monetary policy. Consequently yields in the EU continue to fall; in fact yields on 10 year Greek bonds may soon fall below those of US Treasuries! Hence, while a decent U.S. jobs report this Friday could confuse matters for Powell, pricing in 100 bps of cuts & the subsequent breakdown of the dollar seems a stretch, at least until improvement in Europe is broader and more durable.
If this scenario plays out, then economically sensitive commodities are unlikely to break out to the upside, the USD won’t breakdown, and the 10-2 U.S. yield curve will remain a hindrance for bank stocks. To make matters more confusing, let’s throw President Trump into the equation. Trump’s administration has consistently enunciated concern on the current strength of the U.S. dollar. Assuming the ECB & other central banks continue to be dovish, serving to push their currencies lower, don’t be surprised if Trump’s response is to use tariffs to deal with what he considers to be undervalued currencies. Of course the irony with such action is that tariffs weaken growth which in turn pushes investors to safe havens including the U.S. dollar.
In our look ahead to 2019 report, we wrote that the SPX could hit 3,000 with a China trade deal. Then on May 3rd the S&P 500 closed at a then record high of 2946, just before Trump tweeted that China had changed the terms of what was thought at the time to have been a done deal. That stymied the expectation that the 10% tariff rate on $200B worth of Chinese exports would go away. Now there are 25% tariffs on $250B of imports, the negotiations are filled with distrust and there’s even less chance the Chinese will allow the Americans to have any say in how China manages its internal affairs. Unless there’s notable compromise on both sides it’s tough to see how anything but a cosmetic deal gets done. In turn, this makes it tough for those much hyped ‘green chutes’ of March & April to blossom and reaccelerate global growth.
So while equities made new intra-day highs during post G20 it seems rate cuts are the sole driver. In retrospect, clearly the positioning of our funds underestimated the power of Fed-talk, partially as we remain unconvinced that lower rates will re-accelerate global growth, amidst unfavourable demographics, trade wars, the existing overhang of debt & tepid capital spending. Nor do these characteristics imply strong forward profit growth.
Q2 estimates predict flat to down year-over-year EPS growth, leaving the SPX trading at 18X 2019 operating EPS estimates (just shy of 20X ‘as reported’) & more than 16X 2020 operating EPS. This P:E for 2020 assume EPS growth in excess of 11%, aggressive unless growth picks up and/or the USD tumble, leaving rates, once again as the sole positive driver for stocks..
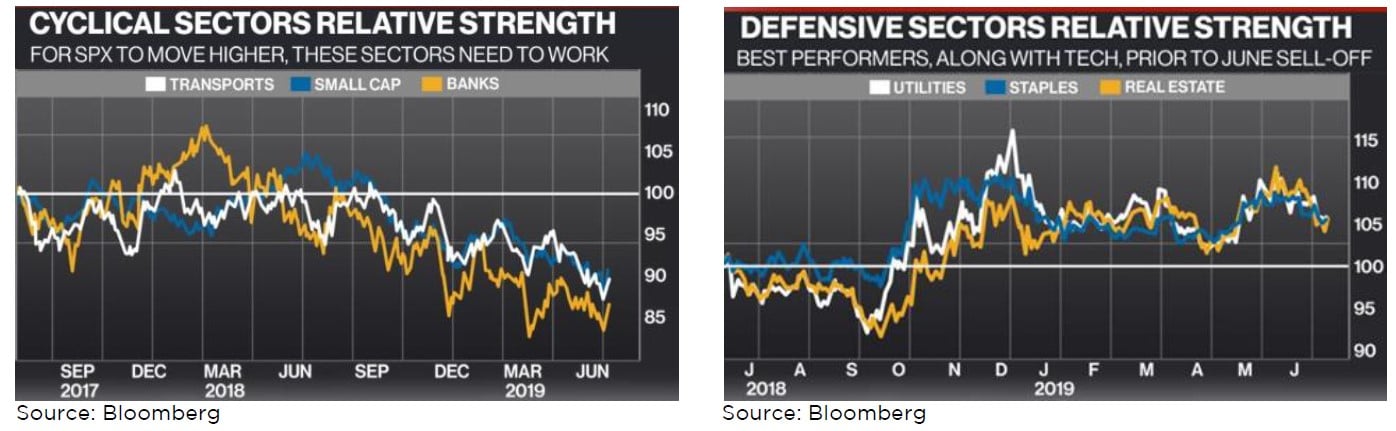
Further, for stocks to move markedly higher, equity bulls will need cyclicals to join the party. If the story remains strictly a rate story, this development may be tough to achieve. The graph on the below left shows that small caps (Russell 2000), banks and transportation, 3 late cycle sectors have hit 1-2 year relative strength lows. In contrast, the graph on the below right illustrates that rate driven, defensive sectors, consumer staples, utilities and real estate remain relative strength winners.
Another sector that has yet to join the party is energy. Our bullish positioning in oil stocks had been (& continues to be) predicated on our belief that markets are too optimistic on H2 U.S. supply growth. Two key reasons drove this view: 1) the Permian is becoming increasingly gassy, with more liquids & lighter oil, and 2) Tier 1 acreage is showing signs of exhaustion, suggesting secondary recovery from shale plays must pick up the slack or else production growth will slow.
Hence beyond our longstanding position in Parex Resources (PXT.CA) we opted to buy heavier Canadian oil plays (Cenovus Energy (CVE.CA), MEG Energy (MEG.CA), Canadian Natural Resources (CNQ.CA)) because they’re: 1) dirt cheap & generating significant amounts of free cash flow, 2) fetch premium pricing for their grades of oil on the Gulf Coast and 3) the outlook for egress, be it pipe or rail, is moving in the right direction, albeit never fast enough. In contrast, U.S. names, a few of which we are short, are expensive and remain unprofitable.
Unfortunately two items have so far stymied the success of the energy portion of our portfolios. First, weaker than expected Q2 refining margins & ample existing inventories due to unplanned refinery outages hurt prices .Second, apathy towards the shares of Canadian oil producers have left some shares trading at 30% discounts to PDP (proven, developed producing) valuations. However as stated in our last commentary, tactically we had fortunately significantly reduced our net exposure to this space.
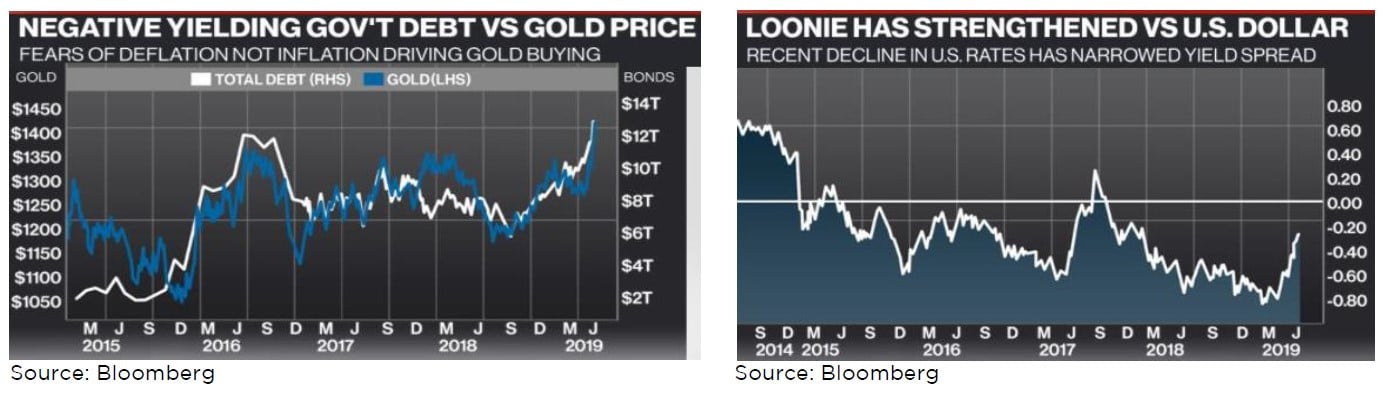
Another resource sector we continue to view favourably is the gold sector. Against a basket of 27 currencies, excluding the U.S. dollar, the price of gold is trading at an all-time high. We attribute this strength to negative real interest rates and, as seen by the white line in the below graph on the left side, the almost US$12T of negative yielding government debt. Having been relinquished of our holding in Atlantic Gold (AGB.CA) via the takeover of the company, our current largest gold position is Barrick Gold (ABX.CA). Given our investing focus on free cash flow generation, Barrick sits at the top of the class. Post the news of an abrupt departure of its CFO, we recently sold our position in Detour Gold (DGC.CA).
Another ‘currency’ that’s been moving higher of late is the Canadian dollar. Recent strength is attributable to falling interest rate differentials between U.S. & Canadian interest rates as is shown by the rising white line on the graph on the right side below. Given that our funds typically hold as much as one-quarter of gross exposure in U.S. securities, we closely monitor the value of the loonie, and reserve the right to hedge any currency exposure. If the FOMC cuts by 50 bps on July 31, the C$ likely moves even higher or if the Fed stands still, expect the loonie to give back some of its recent gains.
Despite recent strength in the loonie, Materials were a top contributor to the performance of our funds last month. Gold stocks led this category but positive contributions were also made by Lundin Mining (LUN.CA) and U.S. chemical company Kraton Corp (KRA.US). Also, benefiting from falling yields, our allocation to the Utilities sector generated profits. On the losing side, little surprise given the strength in indices, our market hedges, both ETFs and listed put spreads, were the biggest losers. In addition we lost money in the Consumer, Non-Cyclical sector.
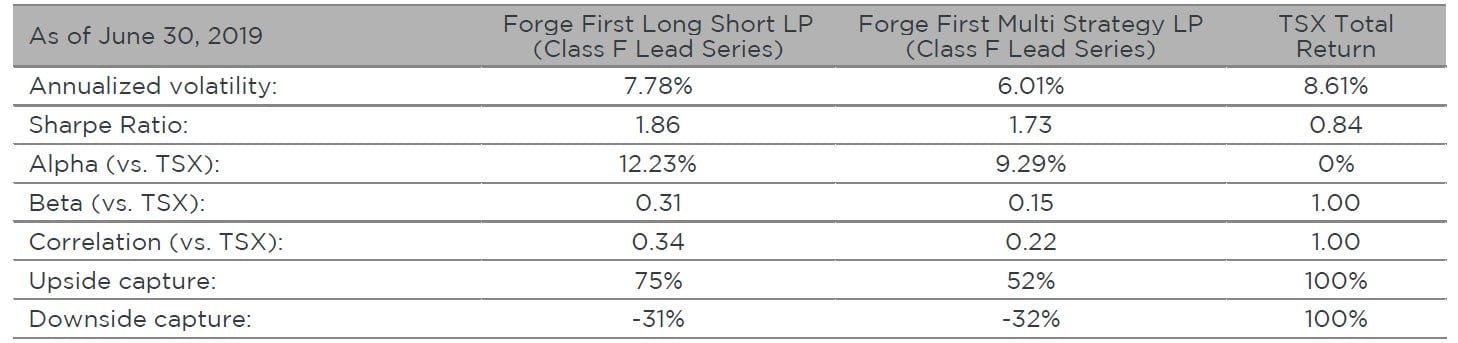
Moving on to our scorecard, as can be seen in the table below, each of our two funds, Long Short & Multi Strategy continue to feature strong Sharpe ratios, a measure of risk adjusted net return, solid negative downside capture, and below market volatility. While we would have preferred to have our funds make more money than they have year to date, experience has shown us that it’s imperative that an investor stick to their discipline; and for us, that means buying mid and large capitalization public companies that generate free cash flow and aren’t too aggressively (meaning expensive) priced and shorting companies who are either using cash and/or have a need to keep coming back to the market place, such as our short position in Tesla (TSLA.US).
To summarize, as we don’t believe monetary stimulus will reinvigorate global growth, profit estimates will be revised lower, and while even further monetary ease could push stocks higher for a time, eventual downside risks would be moving higher too. By sticking to our discipline we remain confident that we will continue to deliver to our investors our targeted risk adjusted net return goals.
Please visit our website for information on our funds. Should you have any questions, please contact us.
Thank you,
Daniel Lloyd
Portfolio Manager
Andrew McCreath
President and CEO


