
Good Things Come in Small Packages: CME’s new Micro Futures Debut Exceeded Expectations, Considered a Huge Hit
New product launches from exchanges often are a crap shoot. The projections for the acceptance and use of new listed derivatives rarely match up with actual trading volume. The launch last week of CME’s new Micro E-mini futures on broad-based indexes likely exceeded everyone’s expectations. TABB Group head of derivatives Russell Rhoads breaks down the successful launch.

Q1 hedge fund letters, conference, scoops etc
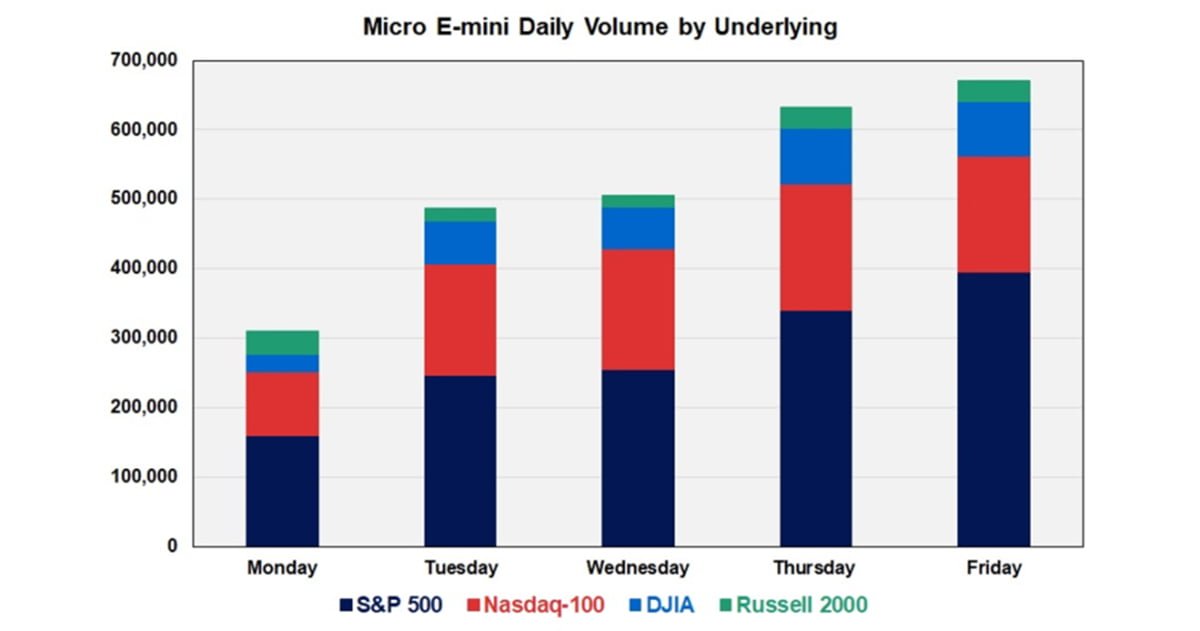
New product launches from exchanges are sort of a crap shoot. An exchange will identify a market segment that is underserved or create a deviation on a successful product, hoping demand is there. In reality, the acceptance and use of a new listed derivative can be guesstimated before launch, but the guesses rarely match up with actual trading volume. In the case of the newly launched Micro E-mini futures on broad-based indexes, I can’t imagine anyone guessed how strong volume would be during the first week of trading. Exhibit 1, below, breaks out the daily volume for each of the four Micro E-mini futures contracts introduced last week by CME.
Exhibit 1
Data Source: CME Group
Volume for the Micro E-mini futures increased every day last week, nearly doubling from Monday to Friday. Market volatility can be cited for Friday’s big day, but other broad-based index futures markets witnessed lower volume days last week on Wednesday and Thursday versus Tuesday. This clearly indicates the increase in Micro volume came from new traders entering the market or an increase in volume from traders who were very early adopters.
The S&P 500 contracts dominated the volume, with about 1.4 million contracts traded for the full week. Combined volume for the other three contracts was just over 1.2 million, with a total of 2.6 million Micro E-mini futures traded in the first five days since being launched. To put all these numbers in perspective, the biggest volume day on record for the much-hyped Bitcoin futures contracts that were launched more than a year ago is about 22,500 contracts.
The new Micro E-mini contracts are one-tenth the size of the associated E-mini futures, which have been around for decades and have been a favorite for day traders. However, the notional size of these E-mini contracts has grown as the stock market has marched higher; as a result, single contracts have a very large notional value. For instance, based on Friday’s June E-mini S&P 500 Future close of 2887.25, each contract represents $144,362.50. The new Micro E-mini contract value is $14,436.25, a bit more reasonable for retail traders. The table below compares the four Micro and their respective E-mini contracts in terms of notional value based on Friday’s close:
Exhibit 2: E-mini and Micro Stats Based on Friday (5/10/19) Price Action
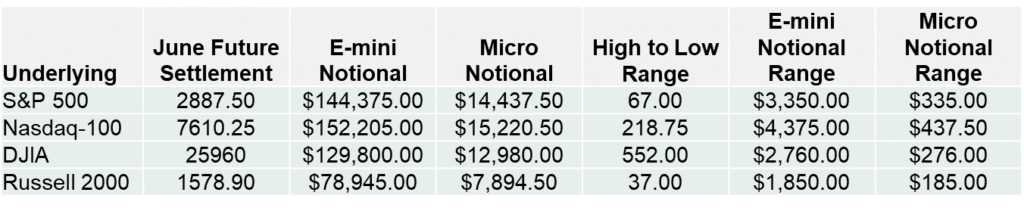
Data Sources: CME Group and TABB Calculations
Friday was an exceptionally busy and volatile day in the equity markets due to the ongoing trade dispute with China. This resulted in a pretty wide high-to-low range for all four markets, which offers a good illustration of the fluctuation in value for each of the E-mini and Micro contracts.
One of the most efficient methods of gaining exposure to the performance of a broad-based equity index is through the ETF market – four of the most popular ETFs are funds that offer this sort of exposure – and many retail traders use these ETFs to speculate on short-term moves in the equity markets; this is the audience that will probably be most interested in the new Micro contracts. The table below uses the price action in each market from this past Friday (May 10, 2019) to offer a comparison of trading 100 shares of each ETF versus trading the respective Micro contracts.
Exhibit 3: ETF and Micro Stats Based on Friday (5/10) Price Action
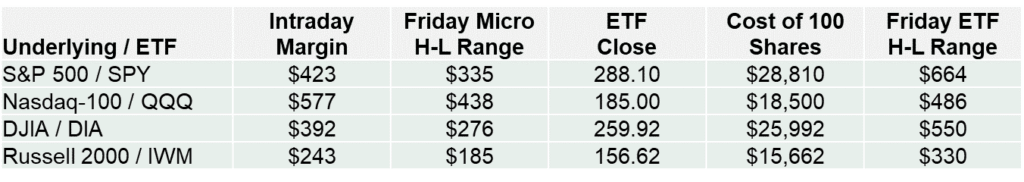
Data Sources: CME Group, Interactive Brokers, Yahoo Finance, and TABB Calculations
The Intraday Margin figure can vary from broker to broker. The figure cited above is from Interactive Brokers’ website. A round lot of ETF shares is used as the trading size for an ETF day trader, with the full cost of shares cited as the capital commitment for a day trade. Even at 50% margin, this figure is much greater than the margin required to trade a single Micro future.
The dollar range for three of the four ETFs is about twice that of the comparable futures, with the Nasdaq-100/QQQ range having less than a $50 difference. Regardless of how the comparison is made, the Micro contracts offer a much bigger bang for your buck with respect to short-term equity market exposure. Greater stock market exposure is available with the established E-minis, but the size of those contracts has priced them out of many individual traders’ comfort zones.
CME representatives have already stated that the Micro contract launch is the most successful new product launch in years, if not on record. It is still early days and with new products, volume and liquidity often attract more volume – or at least, traders who will take a look at the new product.
The biggest question so far is: “When do we get options Micro E-mini futures?” I’m sure CME has thought about this already; after the success of Micro futures, they can’t be far behind.


