
Saga Partners letter to investors for the first quarter ended March 31, 2019, discussing their investment thesis on Trupanion Inc (TRUP).
Annual Luncheon
Our second annual luncheon will be held in August. We will be sending out further details once the date and other details are set. Hope to see you all there!

Q1 hedge fund letters, conference, scoops etc
1Q19 Results
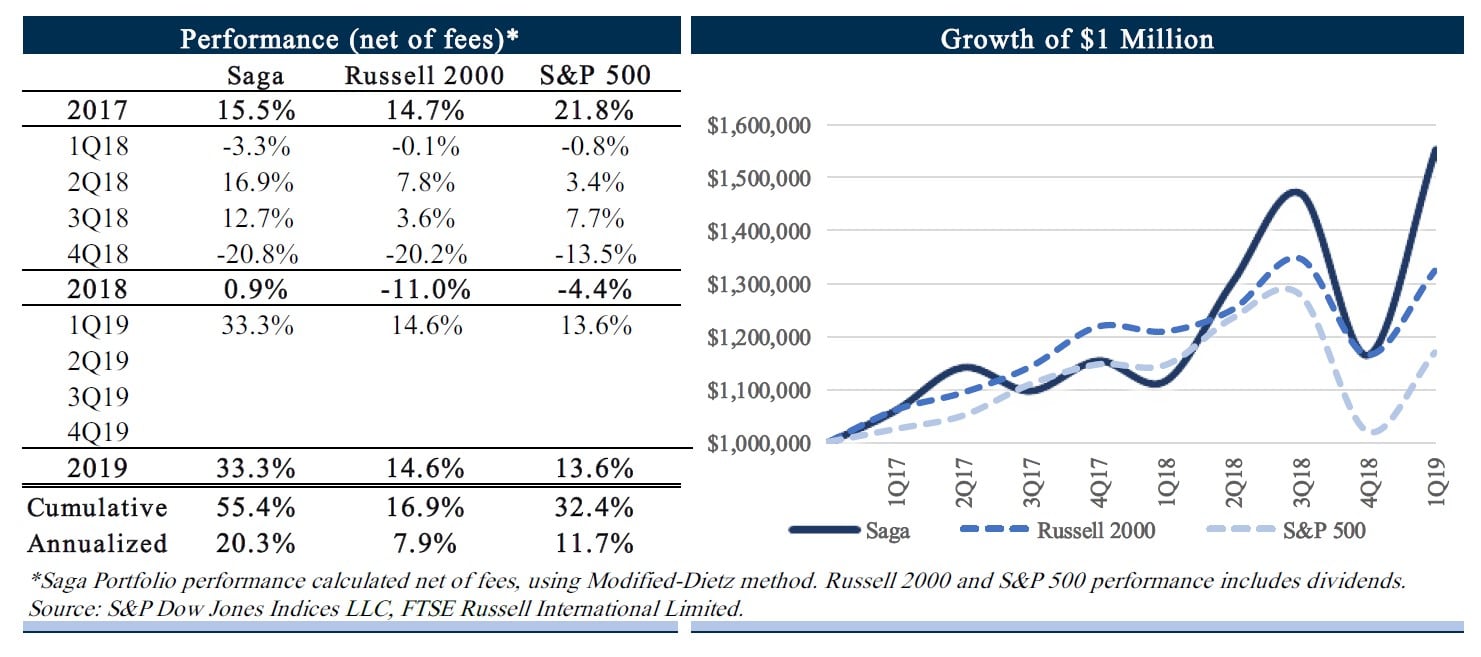
During the first quarter of 2019, the Saga Portfolio (“the Portfolio”) increased 33.3% net of fees. This compares to the overall increase, including dividends, for the Russell 2000 and S&P 500 Index of 14.6% and 13.6%, respectively. Since inception on January 1, 2017, the Saga Portfolio returned 55.4% net of fees, compared to the Russell 2000 Index and the S&P 500 of 16.9% and 32.4%, respectively.
Interpretation of results
When we wrote about Mr. Market’s bi-polar behavior in last year’s third quarter letter, little did we know at the time we were about to go through one of the worst quarters, then subsequently one of the best quarters since S&P 500 data became available. It’s very interesting how quickly the market can swing from “risk-off” to “risk-on” over a relatively short period when the fundamental business environment changes little.
We make no attempt to predict how the markets will behave. There is a lot of noise in everyday commentary. Our advice is to ignore it. We understand and recognize the innate desire in trying to know the future but forecasting short-term stock price movements is something we think neither we nor anyone else is able to do successfully.
Our strategy for an inevitable future economic downturn is not to predict and profit from it, but to buy companies that will survive and likely benefit, either from being relatively immune to it or gaining a further advantage at the expense of weaker competitors during hard times. Buying quality companies, when priced right and run by honest, intelligent management teams, offers the best defense against challenging macro conditions. Over time, we expect our companies to be worth considerably more money than what we originally paid for them despite where we think we may be in a business cycle.
We hesitate to even discuss quarterly results because short-term returns are more or less random. However, we can confidently say that a +33% quarter is an anomaly and partially a subsequent reaction to the steep sell off at the end of last year. Many investment managers of average ability have recorded outperformance as well as underperformance over short periods. Evaluating investment results is like judging a round of golf. While a birdie on one hole may be nice, it’s the entire 18-hole round that counts. It is more important to focus on the long-term compounding returns of the Portfolio over a period of multiple years. Striving for quarterly or yearly returns would hurt and most probably prevent any potential for outperformance.
We think at least a five-year period of performance compared to the general market is a reasonable time to begin to assess an investment strategy, preferably with tests of relative results in both strong and weak markets. Once we have about five holes on the scorecard, we should start to have a general idea for how we are playing as we tee up for the remaining thirteen. In the meantime, we suggest investors evaluate the Portfolio based on its philosophy, decision making, and the consistency of decision making relative to the stated philosophy as we develop a long-term track record.
Philosophy and Process
Several new investors joined the Portfolio over the last few months and since we are saving our semiannual review of the Portfolio’s top positions for the second quarter letter, we thought this is a good opportunity to spend a little time discussing our investing philosophy in more detail.
Our goal is to outperform the market by finding a few exceptional companies to own for the long-term. We evaluate opportunities for the Portfolio by applying four basic filters:
1. Do we understand the company and will it be around/prospering in 10+ years?
2. Is the company growing a durable competitive advantage?
3. Is management high caliber and aligned with shareholders?
4. Does the current price provide an attractive return if the company is owned for 10+ years?
We can usually find a few companies that meet filters 1, 2, and 3, but usually 4 disqualifies the opportunity. Finding the rare combination of these four filters will likely lead to lower risk and market-beating returns without the use of leverage in the form of margin or options.
Our approach when buying a stock is that we will hold it forever. This does not mean we will necessarily own a company forever, just that at the time of purchase we would be willing to own it forever based on our long-term expected returns. There is no time or price in mind for sale.
We are willing to hold a stock indefinitely as long as we expect the business to increase in intrinsic value at a good rate. Catalysts are not something we look for or require. In other words, we have the mentality of buying businesses, not renting stocks. It’s a fool’s game trying to guess where other people will try and guess where a stock will trade. In the short run, prices are driven by an infinite number of random variables that should either be ignored or taken advantage of when they drive prices to their extremes.
We believe our “edge” and the biggest difference between Saga Partners and how most conventional fund managers think and behave is this forever approach. Though references to long-term investing is common throughout the industry, the rhetoric often deviates from actual behavior. Long-term means different things to different people. Much of the investment world only thinks out 1-2 years and then puts some multiple on earnings or cash flow proxy to determine a fair valuation. A smaller group claims to be long-term investors but then states an investment horizon of only three or four years.
In the life of a company, three years is a blip on the radar. The value of a company comes from what it produces for owners over its life, often spanning multiple decades. This fundamental reality naturally leads to a farther outlook, forcing us to focus on factors related to business durability such as barriers to entry, obsolescence risk, and competitive dynamics. If you value a company using simple discounted cash flows, even a more mature, slower growth company will likely have over 80% of its discounted cash flow value come after three years.
Patient and Focused Investing
The enemy of investment success is activity. It’s normal to associate activity with progress and to feel the need to do something all the time. However, the actual important action happens below the surface of the Portfolio through constant reading, learning, thinking, analyzing, and preparing for the moment when a great opportunity comes up.
The major advantage one has investing in the stock market is the ability to patiently wait for the “fat pitch down the middle” opportunity. There is no requirement or reason to try anything overly difficult or reaching beyond one’s strike zone.
You can’t force something to be a good investment because you want it to be. The 10-year treasury will yield what it yields, and a stock will return what it returns. The work is in calculating a realistic expectation of what a company will earn, having conviction in those expectations, and then buying it at an attractive price relative to those expected earnings. If there isn’t a good pitch to swing at, we are ok just standing at the plate. We’ll stay busy waiting by continuously exploring the universe of companies looking for that right pitch.
Focusing on our few highest conviction ideas lying well within our circle of competence naturally leads to a more concentrated portfolio that tends to be more volatile than the indices, something Wall Street and most investors seldom have the stomach for.
Much of the financial services industry is based on the idea of controlling volatility at the expense of long-term returns. When we see people decades away from retirement with a decent allocation of their 401K or IRA in low yielding bonds, including those popular target date funds with high fees, we have to bite our tongue before going off on a tangent about opportunity costs.
Just because you can’t see the unearned returns in your portfolio doesn’t mean you didn’t lose them. Opportunity costs are real. Loss aversion is a normal cognitive bias, with some studies suggesting losses being twice as powerful as gains. In other words, the average person with a $1,000 portfolio would rather earn a steady 5%, providing $1,050 at the end of the year, than a portfolio that rises 20% to $1,200 and subsequently falls to $1,100, for a 10% annual return. While the latter portfolio is the logically better option, leaving the investor with double the return and a fatter wallet, the pain of “losing” $100 leaves them emotionally disappointed.
Investors in the Saga Portfolio understand that volatility does not equal risk, short-term returns are largely random, and outperformance will likely come in lumps overtime. We disagree with conventional portfolio theory of wide diversification into smaller position weightings and rapid turnover, likely leading to more mistakes, frictional costs, and average results at best.
Over the past year we’ve been on calls and had several meetings with prospective investors into the Saga Portfolio. Many times these capital allocators initially express admiration for our general philosophy and results thus far, but in order for them to invest we would need to not only continue to find undervalued stocks, but many more of them, as well as lower allocation to certain names, industries, or geographical regions, and then have monthly update calls to review short-term performance. We are flattered they believe we have the ability to outsmart more people, more often, and in more ways, but we are much more skeptical that we can successfully go into areas of the market that look fairly efficient from our viewpoint and we do not believe we have any significant edge.
One can’t be all things to all people. As we continue to develop our track record, explain our philosophy and how we manage the Portfolio, prospective investors are increasingly self-screening into the Portfolio. More often, interested investors reach out to us after reading these letters and understand what we are trying to do and how we are doing it. Our preferred means of marketing and growing the Portfolio are through these letters and our research. When investors self-screen, it creates an aligned investor base which is also long-term oriented, letting us spend our time managing the Portfolio to the best of our abilities.
While investing is a continuous process of learning and improving, our philosophy and strategy are fixed. We have no interest in trading our philosophy for assets, even if it means it takes longer to grow. We are in this for the long haul and gain more satisfaction from producing strong results by sticking with what has worked for us thus far.
Why we like compound growth companies
There are many ways to invest in “undervalued” opportunities. Despite all the different ways to take advantage of the inefficient spots of the market, the intrinsic value equation has and always will be the same. Warren Buffett often quotes Aesop’s fable, “a bird in the hand is worth two in the bush,” and subsequently adds the two other important investing variables of when you get the birds in the bush and what interest rates are; note birds equal cash.
This goes back to the longstanding topic of growth vs. value investing. Much has already been written on the subject but it’s important for investors to know how we think. Many investors like to bucket certain strategies with growth and value typically being in two separate categories, although a blended version has been created called GARP investing, or growth at a reasonable price.
In our view, every investing decision is a value decision based on what we estimate an asset is intrinsically worth; i.e. how many birds are in the bush, when you will get them, and what interest rates are. Usually people associate growth with more birds in the bush, but one must approximate when you will actually get them. We are simply trying to do what makes the most sense whether it is characterized as growth or value investing. Style definitions are not important to successful stock picking. Success will be based on the accuracy of the analysis and then not overpaying for the business.
Past letters discussed why we invest in “high-quality” companies that have a durable competitive advantage, but why do we prefer companies with strong growth prospects? We have found some of the largest market mis-valuations in companies that can compound earning power far into the future by reinvesting cash flows in either organic or inorganic opportunities. Investors struggle with identifying a fair price for these types of companies because they underappreciate the power of true compounding and current multiples offer a poor proxy for valuation.
High organic compound growth companies typically have large untapped “blue ocean” market opportunities. If there is an attractive, uncontested market space, increased competition is to be expected. Businesses that are able to grow profitably over competition over a long period typically become stronger with size. This is often due to increasing economies of scale relative to competitors or a self-reinforcing flywheel such as a network effect.
Alternatively, companies can grow inorganically by acquiring other companies, often within the same or related industry. Management quality and capital allocation is extremely important. While we have invested in serial acquirers, we have found that talented managers in this field are a rare breed. Even those with a track record of success are just one major acquisition away from a difficult marriage.
Much has been written about how corporate acquisitions often fail to meet original expectations. A KPMG study of 700 acquisitions found that over 80% produced no business benefit in regard to shareholder value. This is largely because projections were too optimistic, purchase prices too high, and buyers were typically at an information disadvantage relative to sellers. That said, there are the few talented managers who are gifted capital allocators and have an ability to repeatedly make successful acquisitions that grow shareholder value over time.
Despite our preference for strong compound growth potential whether organic, inorganic, or a combination of both, the fact of the matter is that it’s extremely rare for companies to be able to compound at high rates for long periods on a per share basis. If you look at the largest 1,000 publicly traded companies by revenue today, the list that had at least a 10% compounded annual growth rate (CAGR) over the last 10 years is not very extensive, let alone those that compounded at a 15% CAGR. If you are looking over a 20-30 year period, you quickly realize how rare the true compounders are.
It can be very dangerous to assume high growth rates into infinity. Numbers become big fast and trees do not grow to the sky. Despite their scarcity, we continue our never-ending search to find the token few that we understand. If we are able to find a small basket of these exceptional businesses and purchase them at reasonable prices, it will likely provide very attractive returns over the long term.
When we do find the rare, long-term compounder with strong prospects, it is typically best to simply hold on for the ride. Few sayings have misled investors more than, “nobody lost money taking a profit”. Selling great companies with large growth potential, even at seemingly rich valuations, is usually a mistake. Phil Fisher may have said it best in his book, Common Stock and Uncommon Profits:
After a sharp advance, a stock nearly always looks too high to the financially untrained. Those who follow the practice of selling shares that still have unusual growth prospects simply because they have realized a good gain and the stock appears temporarily overpriced seldom buy back at higher prices when they are wrong and lose further gains of dramatic proportions.
Valuation – growth is a component of the equation and it takes more than a moat
Valuing high growth companies can be difficult since the expected birds in the bush are much farther away. Reinvesting cash flows today means shareholders must wait at least another year before getting any birds.
If we buy a company valued at $1 billion and want a 10% return on our money, the company will have to pay out $100 million next year and into perpetuity. If the company retains its earnings, therefore paying nothing out next year, it would have to pay us $110 million the following year into perpetuity for us to get our expected return. Every year we have to wait to take out any birds from the bush means we have to take out even more birds later in order to earn our expected return. If we require a 15% return over the long-term, the numbers become that much larger.
Obviously growth is never perfectly linear and we can never precisely predict the exact timing or amount of future cash flows in and out of a business. Therefore we try to keep estimates conservative and focus on high quality companies where business surprises tend to be positive rather than ones that cause pain to owners.
As discussed above, we prefer companies that can reinvest cash internally at high rates of return for a few reasons. Once a high-quality company can no longer reinvest incremental capital at attractive rates, management has more discretion with capital allocation. There is greater risk to potentially hurt shareholder value by pursuing expensive acquisitions with inherently less attractive economics, buying back stock at high prices, or simply holding excess cash on the balance sheet indefinitely. Additionally, when a high-quality business matures and growth slows, the market rarely values a business with predictable cash flows that would provide very attractive returns.
For example, Coca Cola has a wide moat with arguably one of the strongest brands in the world, distribution networks, and scale. It earns high returns on tangible invested capital and operates with little to no tangible equity. Despite having a strong durable moat, Coca Cola lacks attractive reinvestment opportunities.
Carbonated and flavored beverage markets are low growth and largely saturated. In recent years, Coca Cola’s unit volume and price/unit have both grown in the low single digits, providing low to mid-single digits organic sales growth. Gross sales have only grown at a 1% CAGR since 2007 (going back to 2007 to exclude 2008 recession year), share repurchases and margin expansion provided ~4% CAGR in earnings per share. After spending operating cash on capex, management has returned over 100% of free cash flow to shareholders since 2011 through dividends and share repurchases.
Coca Cola shares sold for a similar ~23x price-to-earnings (P/E) ratio at the end of 2007 and 2018. If you held stock from the end of 2007 through 2018, shares appreciated at a 4% CAGR, plus an average 2-3% dividend yield would have provided a total return of 6-7%. This compares to the S&P’s 7% CAGR including dividends over the same period.
Looking forward, we expect shares to return fairly similar returns. When buying shares, we imagine we are buying the entire company. Coca Cola is currently selling for $200 billion. It’s reasonable to expect long-term sales and earnings growth to be around global GDP growth of ~3% a year. In 2018 sales were $32 billion and earnings were $9 billion. If capital expenditures will roughly equal depreciation, earnings are a good proxy for free cash flow. Dividends will provide a 4-5% “coupon” that should grow ~3% a year. This will provide a longer-term return of 7-8% a year, on a $200 billion investment if all earnings are distributed out. These expected returns are satisfactory though far from inspiring when trying to beat the market.
We would be perfectly happy to invest in a high-quality, lower or no growth company like Coca Cola if the earnings can truly be returned to shareholders and we purchased the company at an attractive price relative to those expected no-growth earnings. Despite Coca Cola having a wide durable moat, expected future returns from today’s price do not look overly attractive if shares were held over the next 10+ year period.
Portfolio Update
We will provide a semiannual update of the Portfolio’s top positions in the second quarter letter. During the fourth quarter, we started a position in Trupanion and added to it at the beginning of the year. At the end of the letter is a research report outlining our investment thesis that was featured as a finalist in SumZero’s Top Stocks for 2019 contest in December. It is more extensive than our typical investment review, but we wanted to include it since Trupanion has since become our 6th largest position.
Conclusion
We are grateful for the opportunity to manage our investors’ hard-earned capital. The success of the Saga Portfolio requires investors that are stable, long-term, and realistic in their expectations. So far, we could not be happier in this regard. We would love to continue to grow with like-minded investors. If you know someone that may potentially be interested in an alternative investment strategy like the Saga Portfolio, feel free to forward on our information. As always, please reach out if you have any questions or comments, we are always happy to hear from you!
Sincerely,
Saga Partners
Trupanion, Inc. (TRUP)
Investment Thesis
- U.S. pet insurance industry is under-penetrated with a large addressable market.
- Trupanion is building a durable advantage as the low-cost pet insurance provider, growing economies of scale, and strengthening its network of veterinary hospitals through its national sales force of Territory Partners.
- Founder-led with a strong CEO that is aligned with shareholders.
- Valuation looks very attractive based on high IRR reinvestment opportunities, market growth, and strong cash flow generation at scale.
Trupanion Background
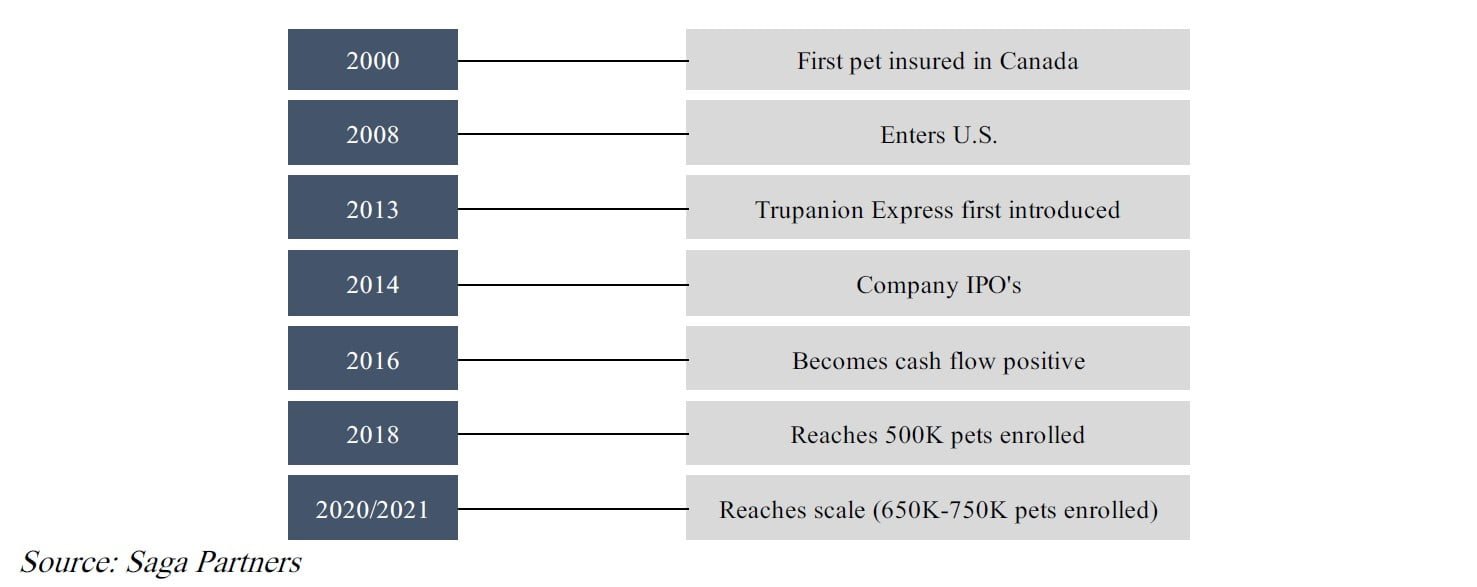
Headquartered in Seattle, Trupanion is a monthly subscription service provider of medical insurance for cats and dogs in the U.S. and Canada. The current CEO started the company in Canada in 2000 and entered the U.S. in 2008. Since then it has grown to be the second largest pet insurer in North America.
Before Trupanion entered the U.S., pet insurance was typically a bad product. Pet insurers set premiums at a low price point but excluded many of the conditions causing a bad customer experience. Trupanion was the first pet insurer to offer comprehensive insurance that covered hereditary and congenital conditions, the health issues pets are most likely to have. Trupanion pays 90% of the veterinary costs with the pet owner paying 10%. There are no payout limits or lifetime maximums with the only costs not covered related to pre-existing conditions prior to the pet’s enrollment and routine or preventative care such as examination fees. The goal of the policy is to be a simple and easy to understand medical plan that provides pets with the best medical care while helping pet owners manage the costs.
While Trupanion is an insurance company in that it pools and redistributes risk, the business looks more like a monthly subscription service. Because pet insurance claims are very predictable, uncorrelated, and typically low dollar amounts, Trupanion can very accurately predict its monthly costs. In other words, it’s an insurance company with very short tail risks, therefore it can operate more on a cash flow basis with nominal float.
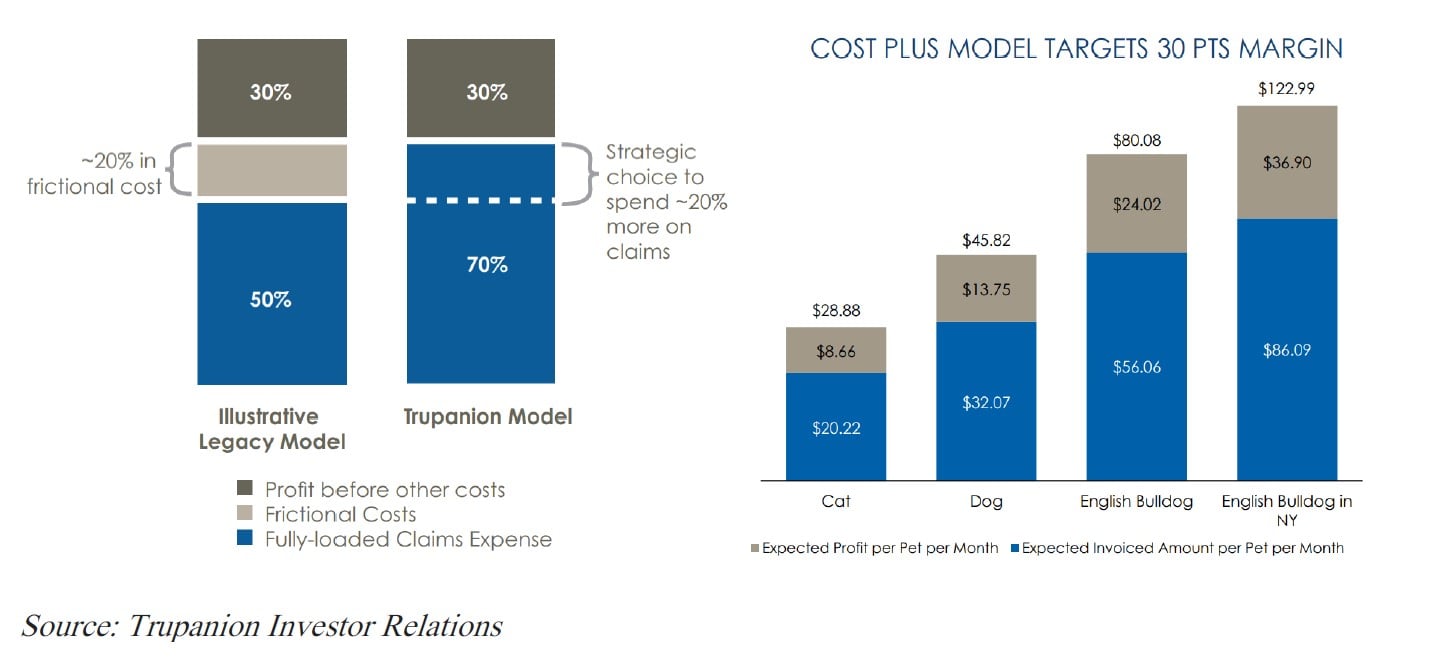
The company uses a “cost-plus” pay as you go monthly subscription model. After accumulating nearly two decades of data, they are able to accurately predict the “average cost” of a pet based on breed, zip code, age, and sometimes even the specific veterinary hospital. Once they know the average cost of a specific pet category, they add a 30% margin in order to target a 70% claims payout ratio, while most pet insurance competitors payout ratio is closer to 50-60%. Part of Trupanion’s “pricing promise” is to always price the premium with a target 70% veterinary claims ratio so customers know they are getting the same value regardless of their location or pet.
U.S. Pet Insurance Industry
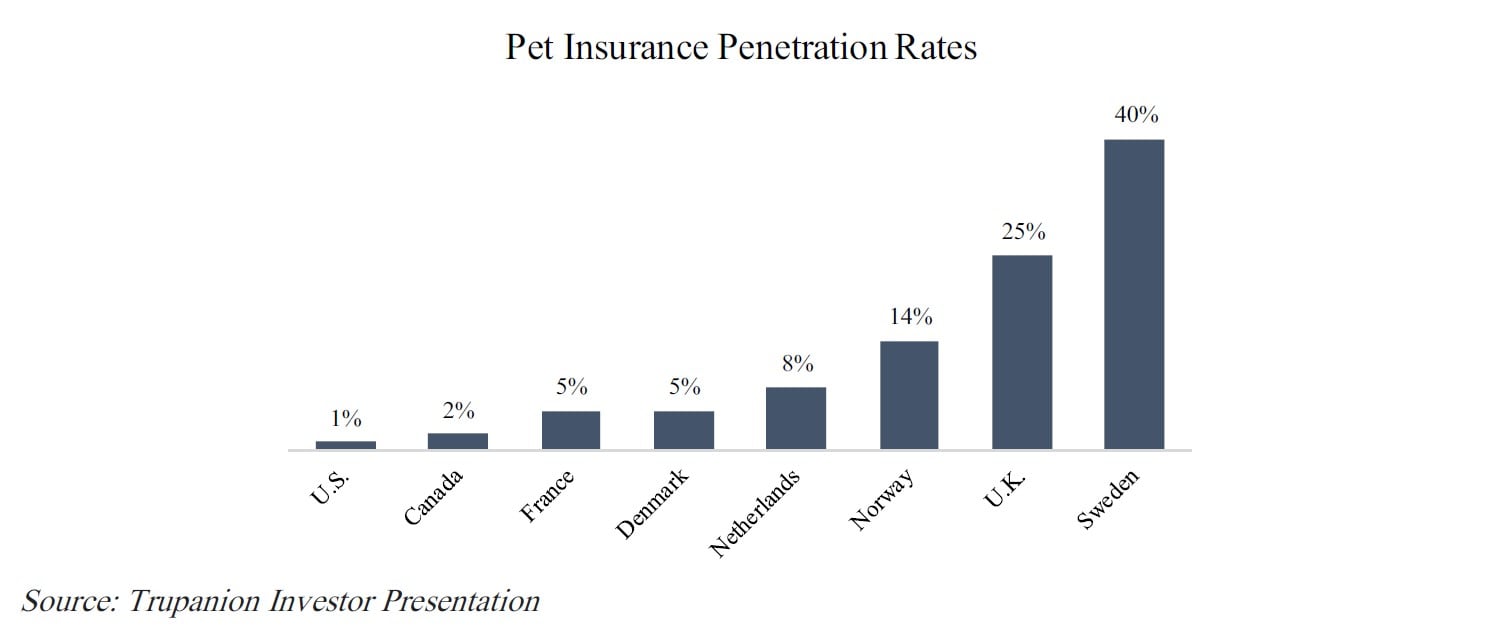
Pet insurance in the U.S. is significantly underpenetrated if you compare it to other developed countries. In the U.S., only about 1.5-2.0% of pets have insurance while it’s 5% in France and Denmark, 14% in Norway, 25% in the UK, and 40% in Sweden. Even Australia, South Africa, and Japan have 5-15% penetration rates.
The important question is why is there such a large discrepancy relative to other developed countries when the U.S. has typically been a leader in financial services?
One view for lower penetration rates is the average person would be financially better off simply saving their monthly premium and paying out veterinary costs as they occur with their specific pet. That view is more a statement on the general purpose of insurance than specifically pet insurance. People buy insurance of any kind to help them pay for large, unexpected or unplanned expenses for which they would have trouble paying for out-of-pocket. The reason for not buying pet insurance would be the same for not buying life, rental, home, dental, eye, or general health insurance since it will no longer be required by law.
While the average pet owner would be better off saving the monthly premium and paying out vet expenses as they occur, the average pet owner usually only owns 1-3 pets at a time. They do not have the benefit of diversifying the risk among thousands of pets. If one of their specific pets becomes sick, the owner can be faced with a hefty vet bill. As more expensive and sophisticated veterinary care becomes more prevalent, including radiation therapy, CT scans, and transplants, customers are increasingly valuing the benefit that pet insurers provide by taking on the risk of potentially expensive procedures in exchange for consistent premiums.
People buy insurance for catastrophe protection. The question any pet owner must ask when deciding to get pet insurance is how much money they are willing to spend on their pet if it has a serious illness or condition. Is it $1K, $5K, $10K? If a pet owner is only willing to spend a total of $1K on vet bills before putting their pet down, spending $600-$700/year in premiums may not make sense financially. If they are likely to spend much more on their pet, to the point it puts a burden on the average person’s budget, insurance likely makes sense.
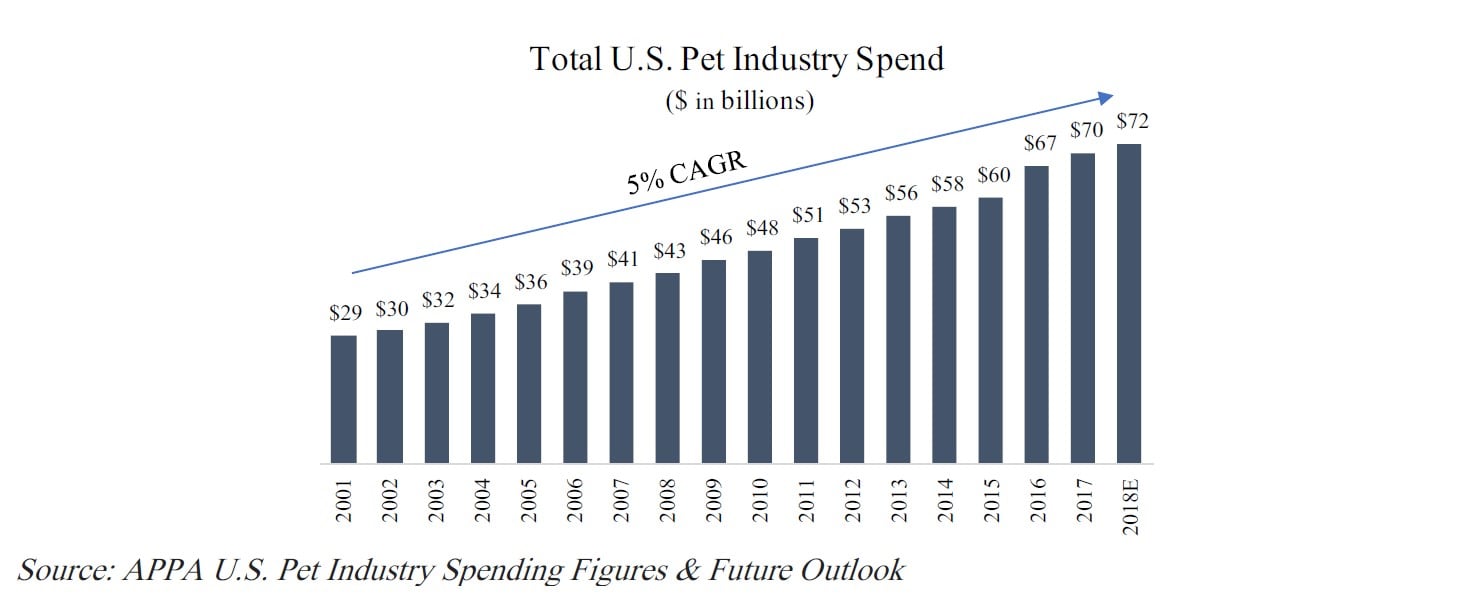
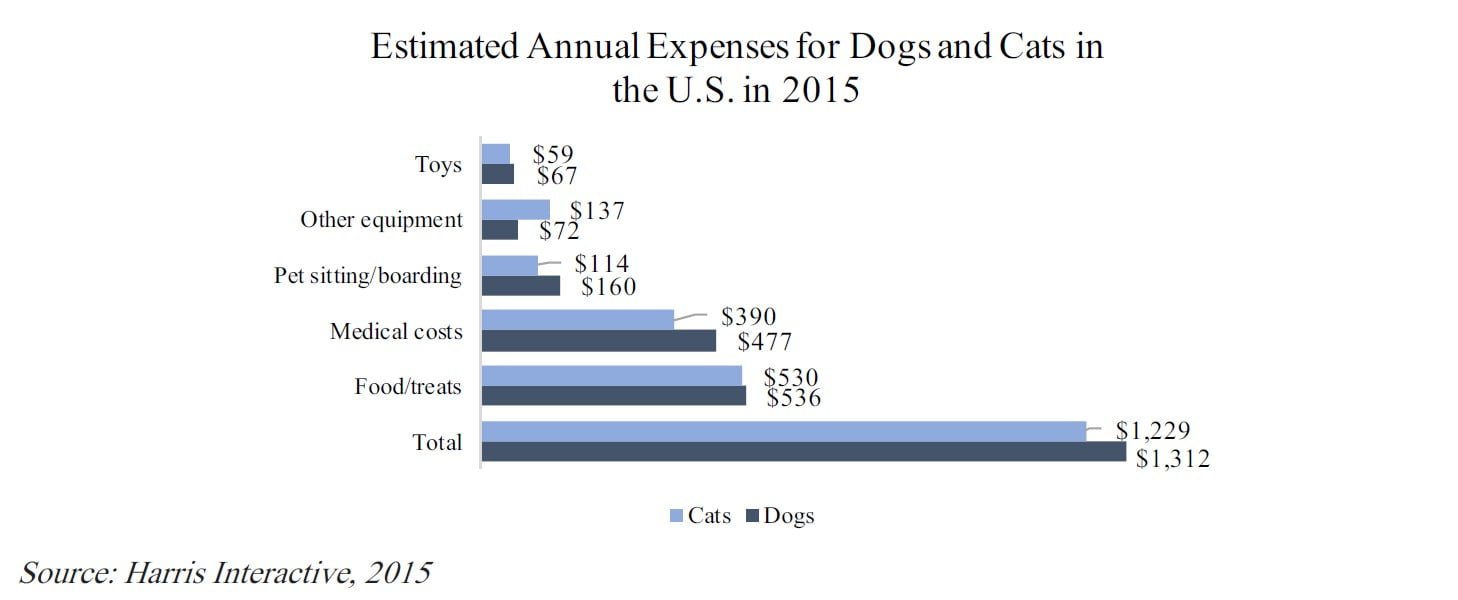
The lower U.S. pet insurance penetration rates are not because disposable income is lower, or U.S. pet owners love their pets less. According to the American Pet Products Association (APPA), U.S. consumers are estimated to spend over $72 billion on their pets in 2018, which is a nearly 70% increase over the last 10 years. A survey by Harris Interactive estimated 91% of U.S. pet owners consider their pets to be family members, 81% consider them equal members of the family, and 58% think of their pets as children. A growing number of pet owners are spending more on their pets whether it’s premium organic food, doggy day care, or general vet care and medicines.
The answer to lower penetration rates is because pet insurance in the U.S. was historically a bad product. In the U.S., pet insurers historically set premiums at a low price point but excluded many of the conditions pets were most likely to have. The insurance products typically had complex policy language, coverage exclusions, and payout caps over the life of the policy and per condition. The result was a bad product with unhappy pet owners and vets reluctant to recommend insurance.
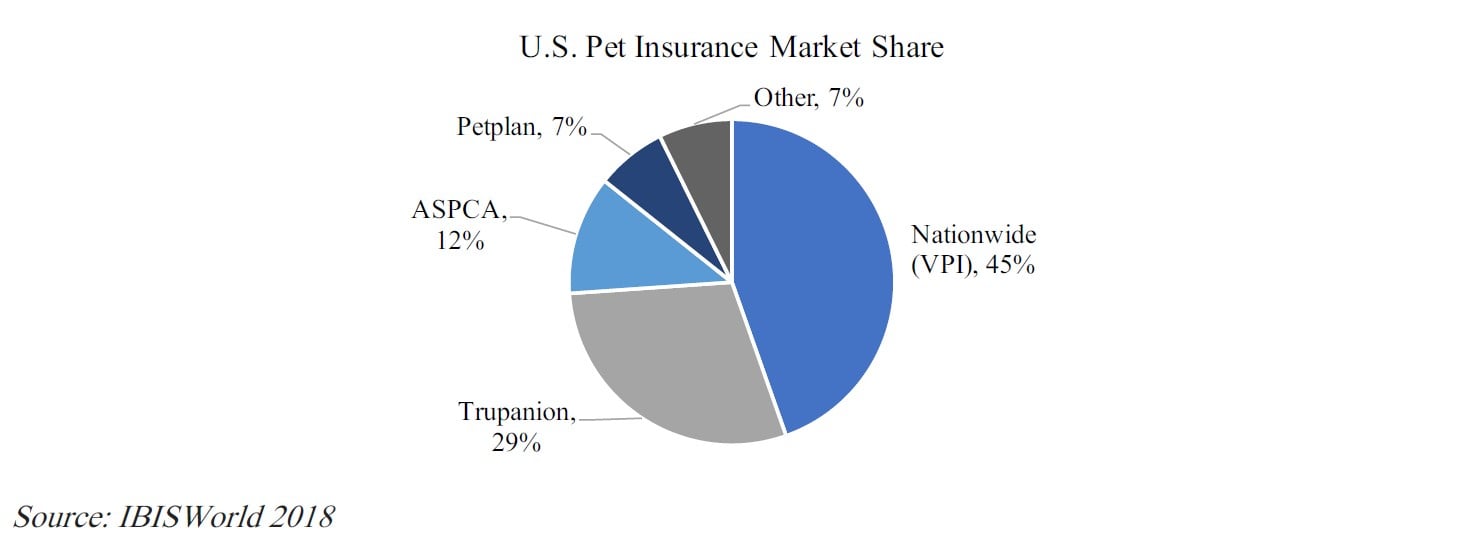
Comprehensive pet insurance started in the UK in the 1970’s but did not come to the U.S. until 2008. While Nationwide (VPI) is currently the largest U.S. pet insurer and its product has been around since the early 1980s, Trupanion was the first company in the U.S. to offer comprehensive coverage. If you use other developed countries as a proxy for future pet insurance penetration rates in the U.S., it’s reasonable to expect demand for pet insurance to have a long runway of growth going forward if the product provides good customer value.
The winners in insurance businesses are going to be the companies that have some franchise based on providing a specialized product, managerial talent, or better distribution. We think Trupanion checks all three boxes. There will be competitors that attempt to copy Trupanion’s product offering, but we think the company has a strong head start that gives it a growing competitive advantage.
Competitors
According to IBISWorld, the U.S. pet insurance industry is highly concentrated with the top four companies accounting for over 90% market share in 2018, a large increase from nearly 70% in 2013. There are an estimated 14 companies operating in the industry with the largest player being Nationwide (VPI).
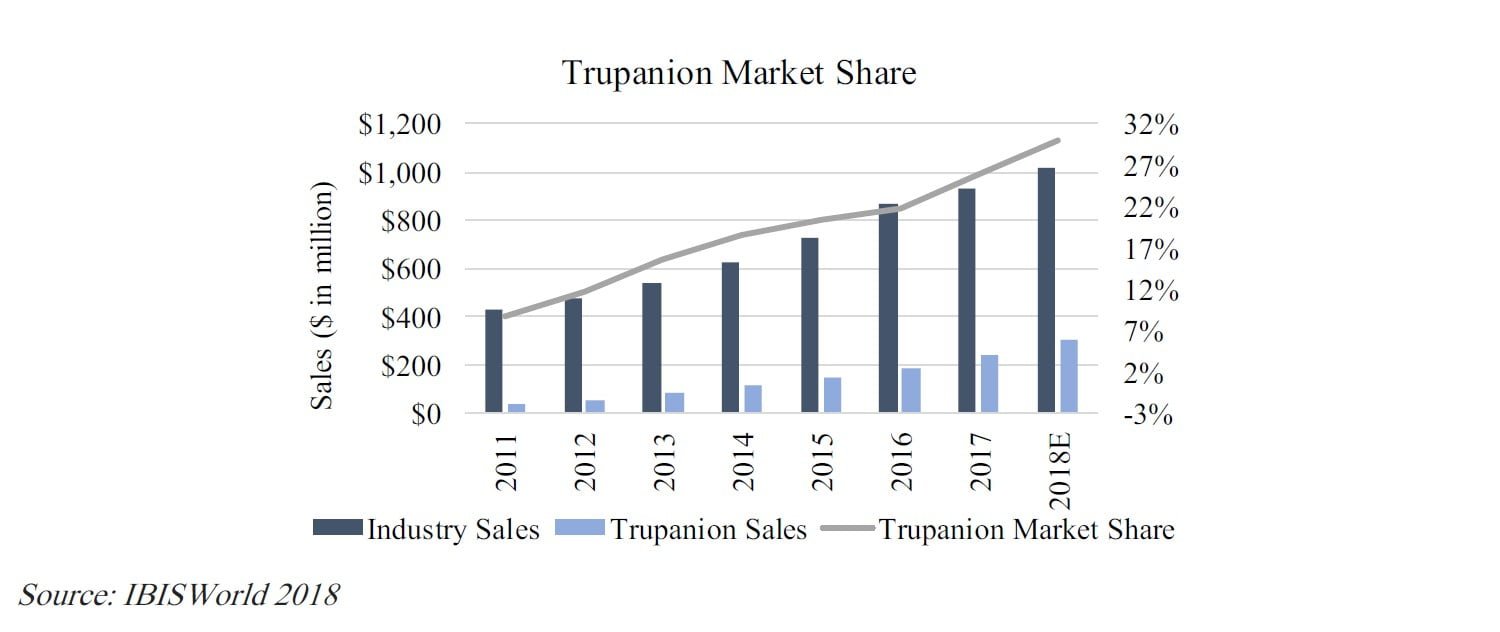
The industry’s increasing concentration is largely attributable to Trupanion’s high growth in recent years. Trupanion’s market share has grown from ~15.5% to 29.3% over the last five years and its market share of newly insured pets is closer to ~40%. Petplan has also experienced strong growth, increasing market share to ~7%. IBISWorld predicts the dominant companies to continue to use their established positions and scale within the industry to drive revenue growth for both themselves and the industry as a whole.
While industry premium volume has grown at a 13% CAGR since 2011, Trupanion has grown at a 35% CAGR as market share reached nearly 30% in 2018. Gains in market share has primarily come by growing the total market of pet owners enrolling in pet insurance versus stealing it from competitors. Increasingly pet owners are learning about the value of having comprehensive pet insurance.
Competitive advantage
Trupanion’s competitive advantage comes from a combination of being the low-cost operator, proprietary data, and their distribution model.
1. Low-Cost Provider and Economies of Scale
Trupanion’s core strategy is to be the low-cost provider. They are committed to having the lowest cost to
administer and the lowest cost to acquire new customers which is very difficult for any new or existing company to copy. Being the low-cost provider does not necessarily mean their product is the cheapest in the market. It means that Trupanion can consistently use a higher percentage of customers’ monthly premiums toward paying veterinary invoices.
Trupanion pays ~70% of premiums collected to veterinary claims vs. the industry average of ~50-60%, meaning their value proposition is about 10-20% better than competitors. Trupanion’s insurance may cost more than some products with certain exclusions but it delivers an overall better value proposition to pet owners. Competitors may underprice policies at times to boost short term growth, although that is unlikely to be a sustainable strategy.
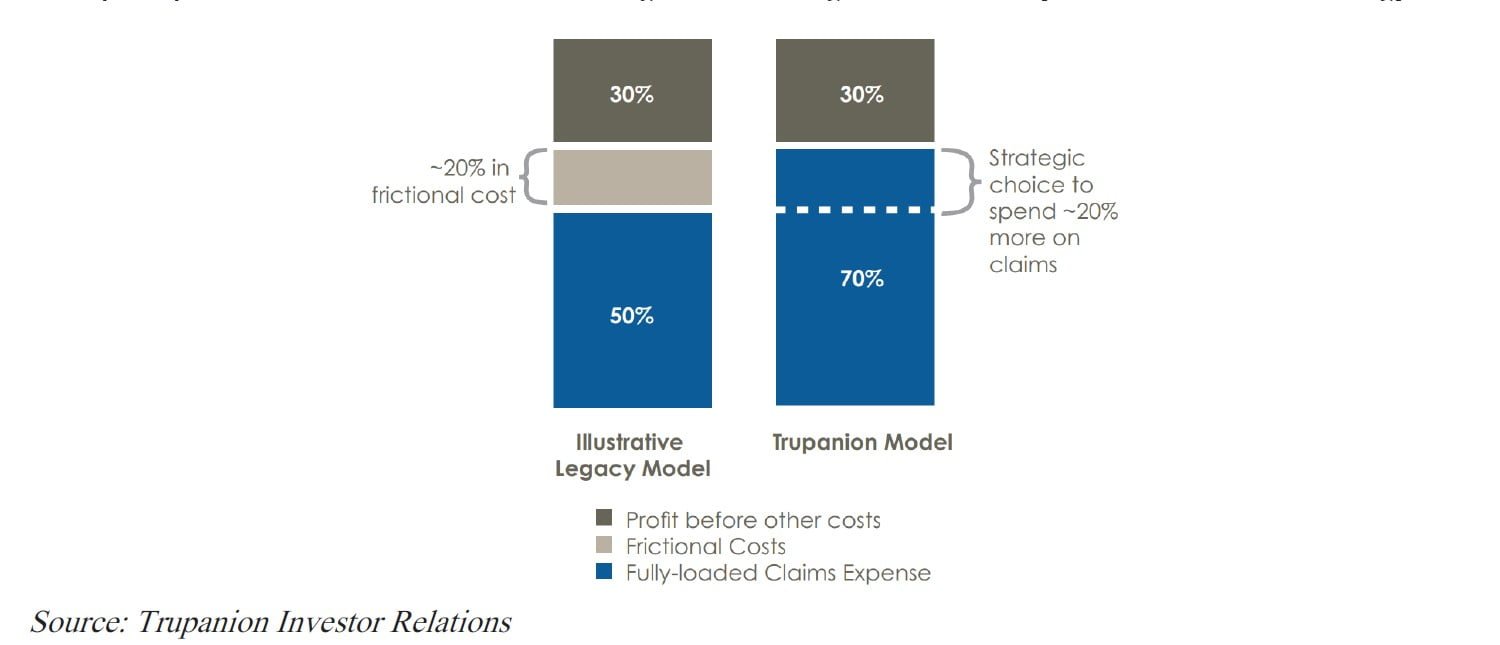
How can Trupanion price their product below competitors but still be profitable? Trupanion is able to price insurance at a lower mark up because they are vertically integrated which reduces frictional costs. Unlike most competitors that outsource insurance underwriting to a third party, Trupanion owns its insurance subsidiary. They do not have to share the profit from underwriting which cuts ~10-12% in costs.
Trupanion also has their own national salesforce of Territory Partners, actuarial team, contact center and owns their brand. In total, vertical integration eliminates between 10-20% in frictional costs that most other competitors experience.
2. Data and Pricing Promise (building a brand)
Current scale and data collected over the past 15 years helps Trupanion price policies more accurately. It has a proprietary database that breaks down 1.2 million different price categories, giving them the ability to price policies down to specific zip codes and sometimes even to vet hospitals while Nationwide and other competitors still price policies by state. Even though companies like Nationwide have been in the market longer, it does not have pricing data going farther back because they only more recently started to offer more comprehensive coverage. An owner of a Dachshund in Eureka, California should not be subsidizing an English Bulldog in San Francisco. The better the data, the more accurate Trupanion is able to price specific policies so pet owners know they are receiving the promised value proposition.
Trupanion currently has ~500,000 dogs and cats insured. They are expected to reach their target adj. operating margins at scale which is somewhere between 650,000-750,000 pets and should happen by 2020/2021 (discussed below in financial section). Once a business becomes the low-cost provider at scale, it has a choice between either keeping prices higher and making more money or sharing some of the cost advantage with its customer.
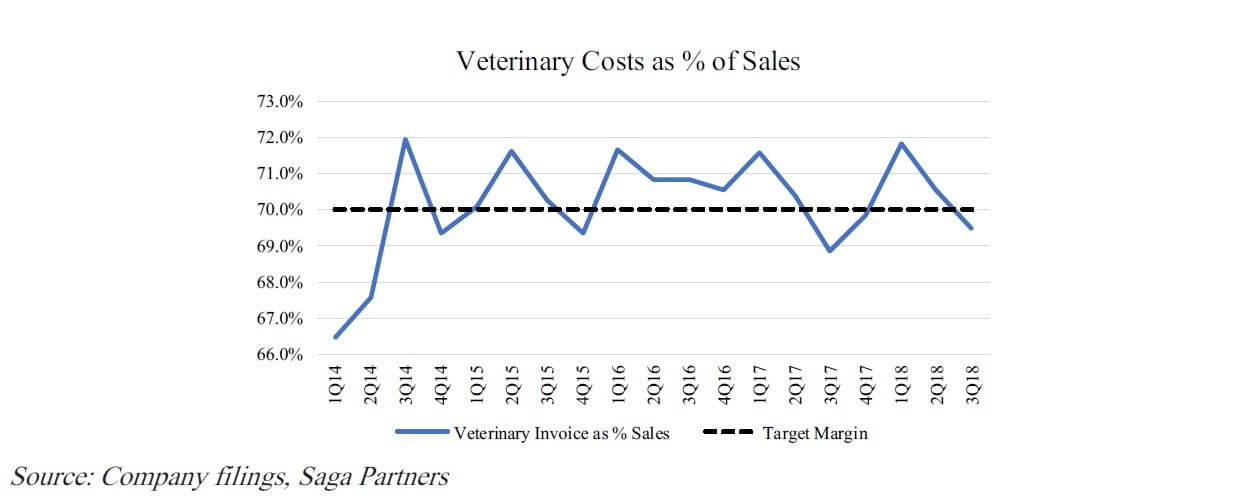
On the 3Q18 earnings call the CEO stated, “today we target and spend ~70% of subscription revenue paying veterinary invoices. Once we achieve our goal of a 15% adjusted operating margin at operational scale, we intend to return any additional cost savings back to the pet owner by the way of an even better value proposition.”
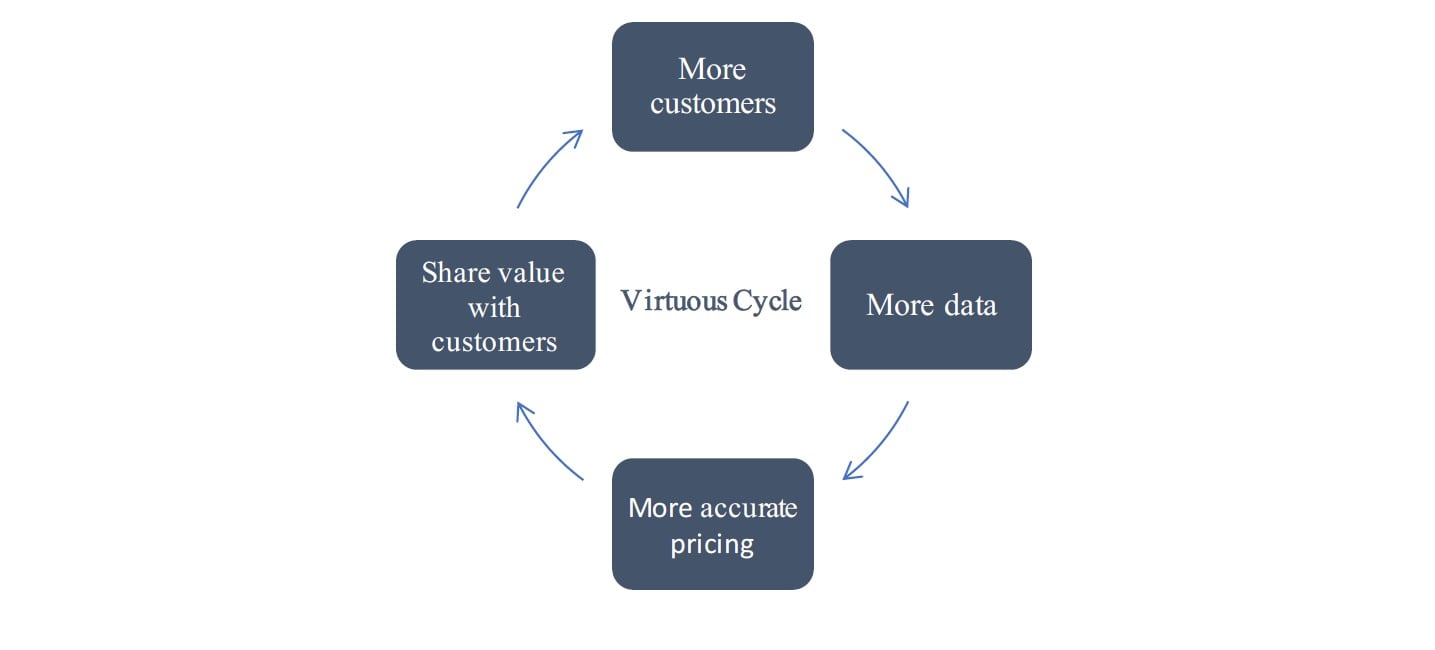
Trupanion has committed to their pricing promise of maintaining its value proposition, by always targeting a 70% payout of premiums collected. Passing on the cost advantage to customers strengthens its brand. Pet owners will know they are getting the most value when they sign up with Trupanion. It creates the powerful self-reinforcing virtuous cycle that we love to find. A company shares its economies of scale with customers, leading to higher demand, and therefore greater economies of scale.
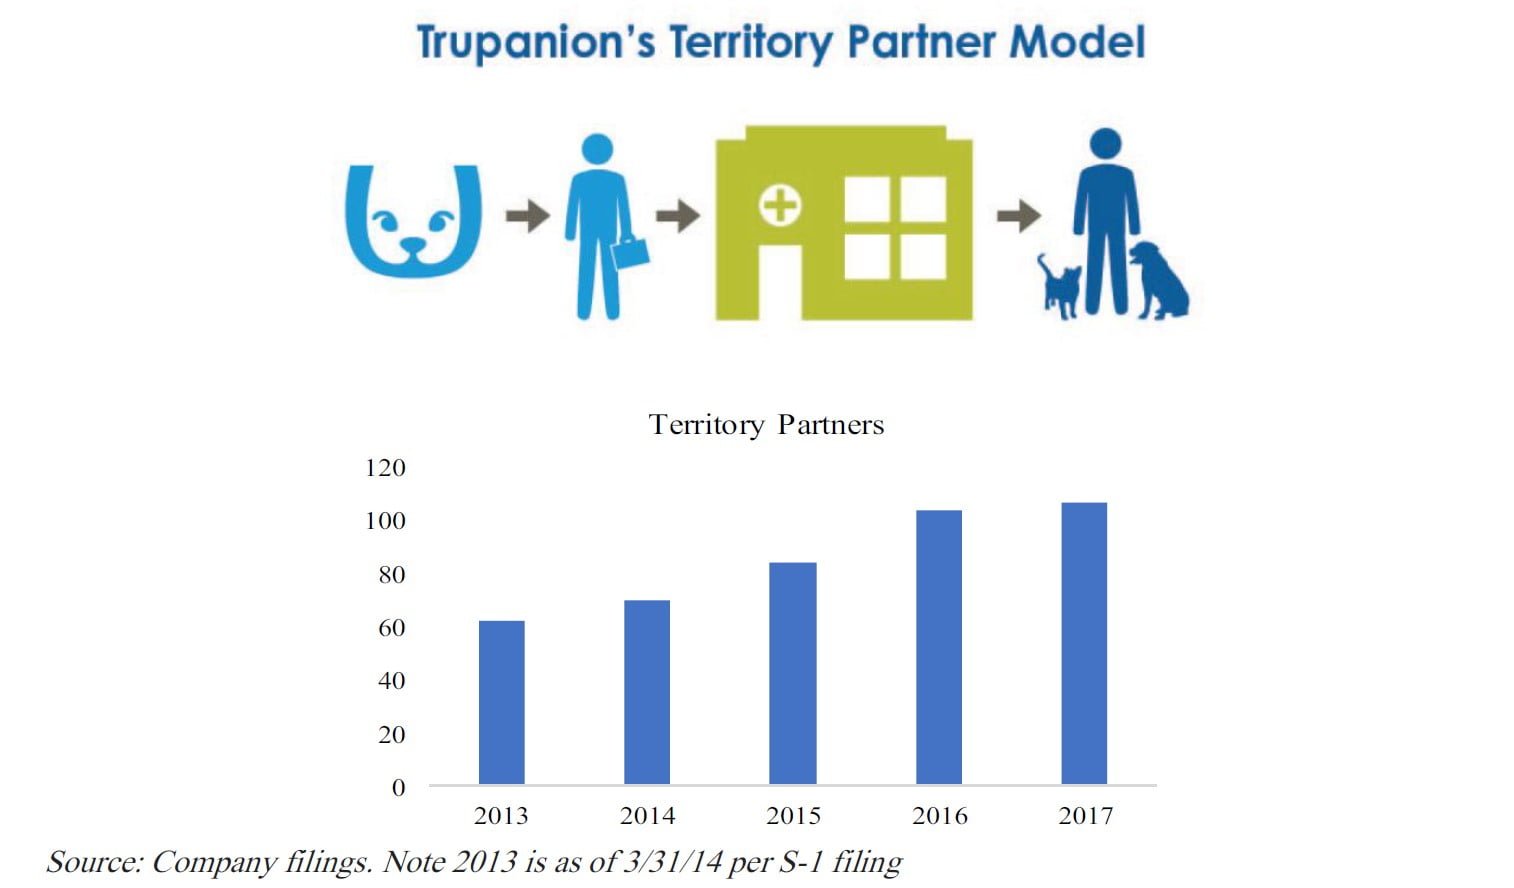
3. Distribution (Territory Partners and Trupanion Express)
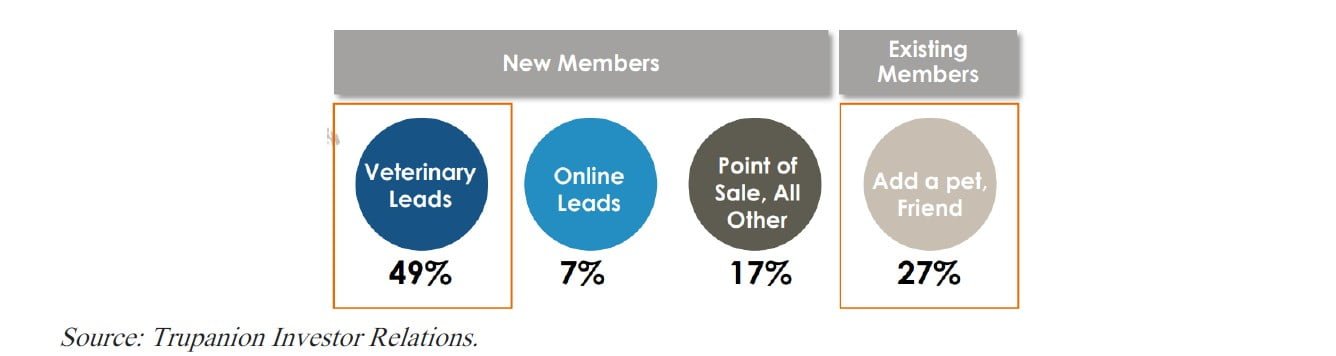
Distribution and customer acquisition costs are key parts of an insurer’s business model. Historically, U.S. pet insurers unsuccessfully used a more direct to consumer marketing strategy. Trupanion has a different model that uses a contracted sales force called territory partners who build relationships directly with veterinarians. This was the primary strategy used in the U.K. and has so far been very successful for Trupanion with nearly 50% of new customers coming from vet referrals. Trupanion is the only U.S. pet insurer with a national sales force that directly markets to veterinarians.
Trupanion has been growing its Territory Partners sales force since 2003 in an effort to build veterinary relationships. Veterinary hospitals are very fragmented and typically owner operated. An average territory has ~2 million people, 1 million dogs and cats, and 250 hospitals. It usually takes 2-3 years of repeated visits to develop relationships with vets before they become comfortable referring pet owners. It would be very difficult and time consuming for a competitor to try and replicate Trupanion’s network of Territory Partners and their relationships with veterinary hospitals.
It’s important for Trupanion to continually strengthen its relationship with vets and customers. One way they did this was by improving the legacy insurance reimbursement model which was slow, inefficient, and created a bad customer experience. The legacy reimbursement model required customers to pay 100% of vet costs out of pocket, then submit a claim and wait for it to get approved and reimbursed which could take 30-45 days. Some veterinary costs can be very expensive and require customers to pay a lot of money upfront.
Trupanion created a software called Trupanion Express. It is a no-cost software that integrates with a vet’s practice management software to enable direct payment by Trupanion to vets. One of the key benefits of the software is that is provides a framework for claims automation. With claims automation, Trupanion can reduce the checkout time to seconds. Overall it removes friction and eliminates pain points for both vets and pet owners.
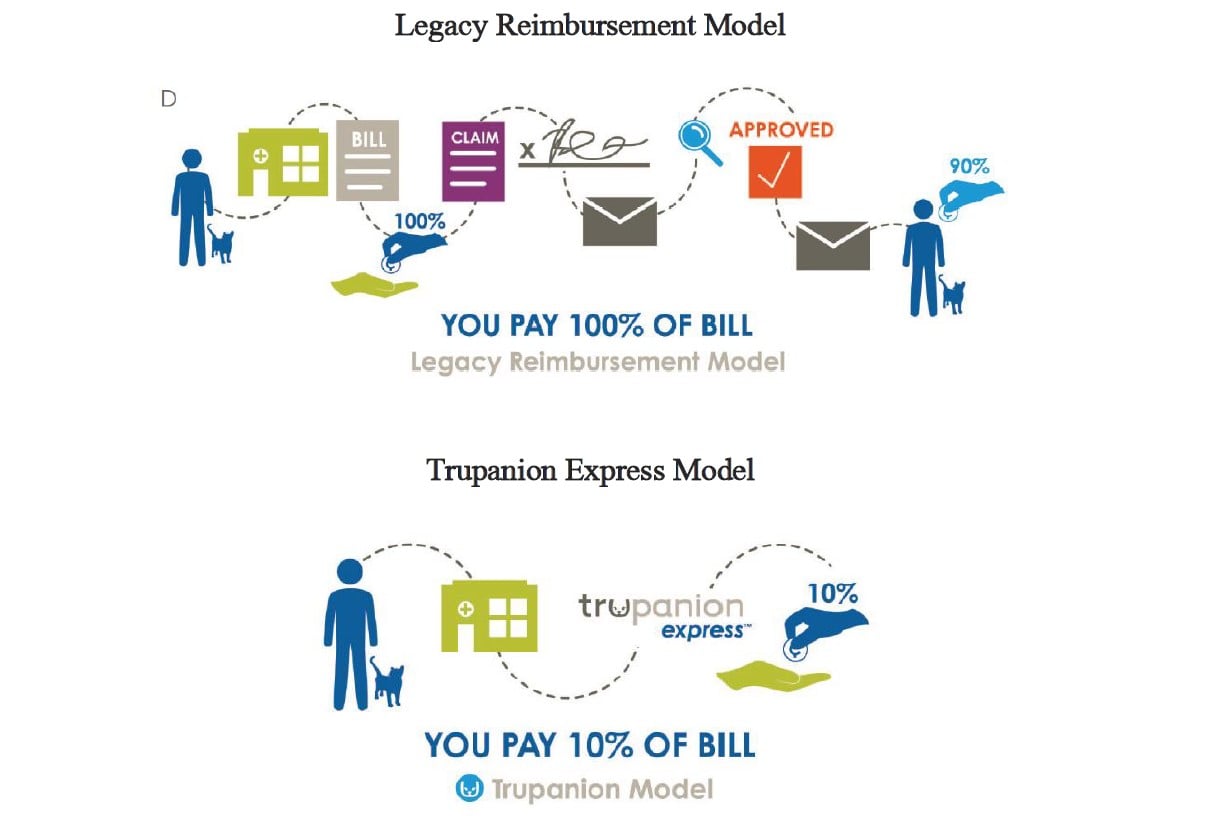
Trupanion Express helps widen Trupanion’s moat by benefiting all parties. Vets benefit because they can move forward with providing care for a sick pet, reduces non-paid accounts receivable, and saves on credit card transaction fees which can improve a vet’s cash flow by ~15%. Pet owners benefit because it reduces their upfront out of pocket costs and removes having to submit a claim and waiting for the insurance company to respond. Trupanion benefits because it collects more data to further improve their pricing models, lowers variable expenses, and strengthens relationships with vets and therefore improves referral and conversion rates of new customers.
Management
Darryl Rawlings is the CEO and started Trupanion in 2000 by insuring his dog. He has a clear vision and goal of becoming the largest and best pet insurer in the world. Usually company annual shareholder letters are more marketing brochures, but Darryl writes out detailed letters that explain how he thinks about the business, its goals, opportunities, problems, etc.
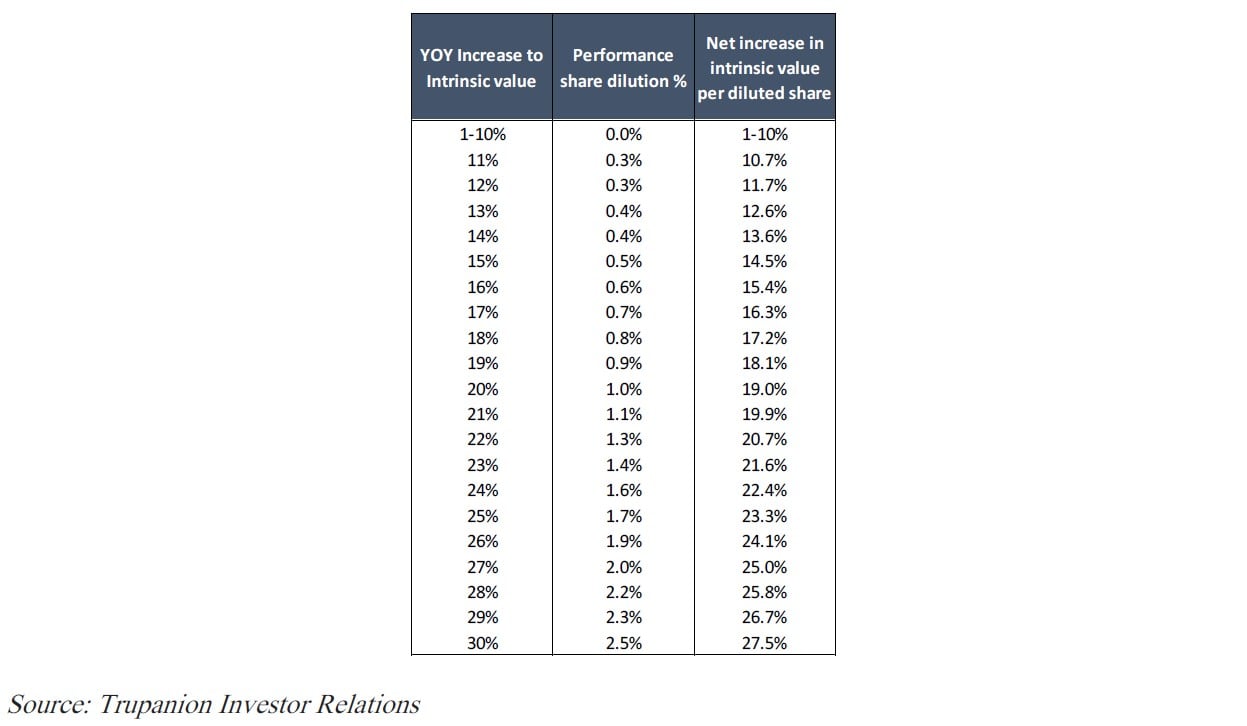
Darryl owns ~7% of outstanding shares which makes up the majority of his net worth. Other insiders own ~3%. Management has taken the owner mentality a step further by providing an equity incentive program that grants shares to all employees based on growth in intrinsic value each year. While rarely fans of companies issuing shares, we like companies that aligned incentives with shareholders and pay for performance. If the employees can grow Trupanion’s intrinsic value at 30% a year, we will happily pay them 2.5% of the growth.
Financials
Trupanion is in the high growth stage of its life cycle, growing sales greater than 20% a year for every quarter since going public. According to their 2016 shareholder letter, they have not had a single month in the last five years in which revenue has been less than the previous month’s revenue. Sales growth is attributable to enrolling more pets and increases in monthly revenue to pet.
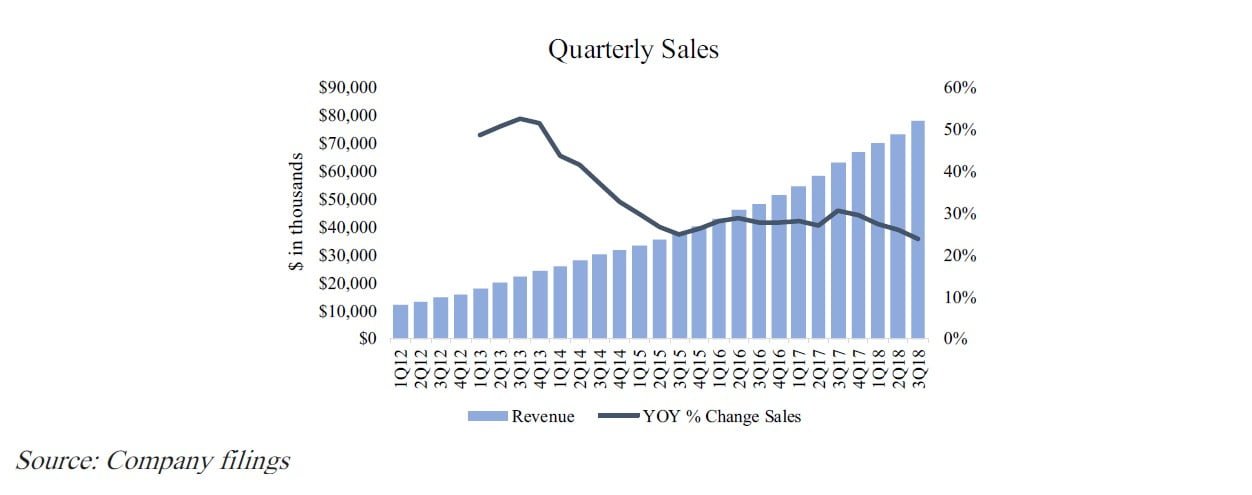
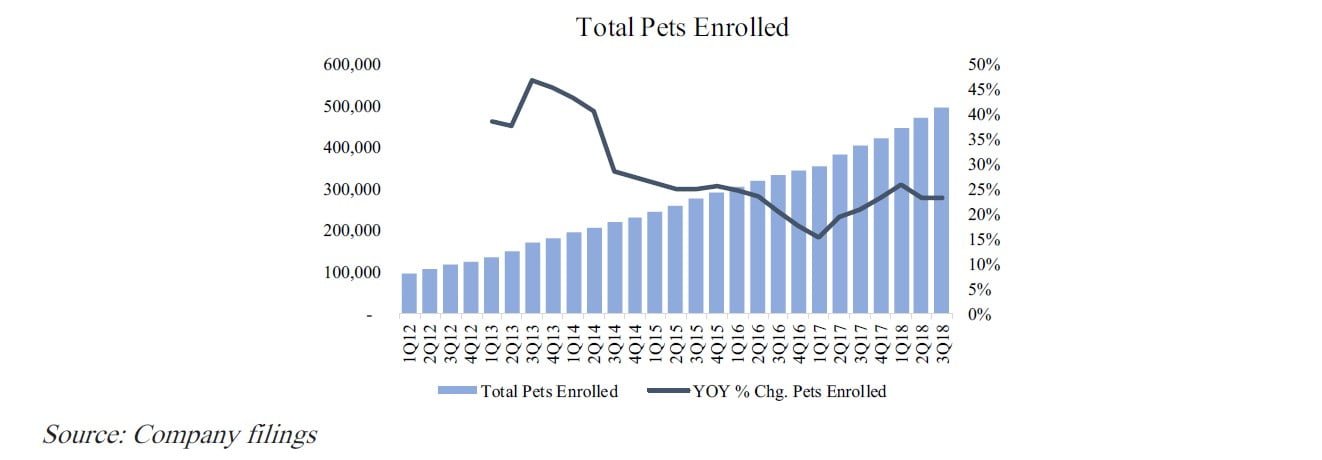
Total pets enrolled has grown over 20% YOY for nearly every quarter since going public.
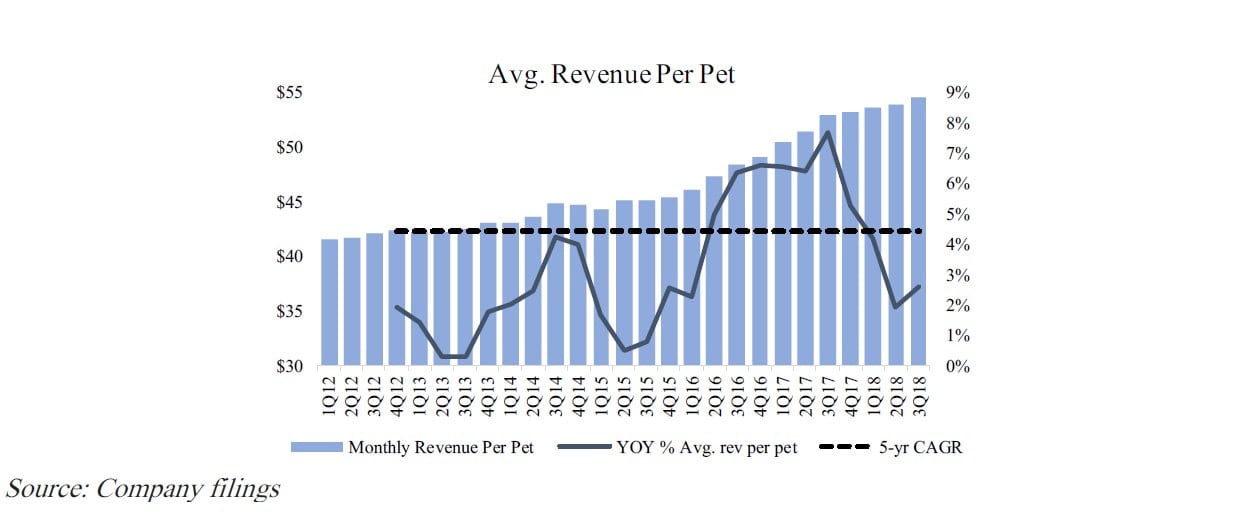
Average revenue per pet has grown at a 4-5% CAGR since the company has been public. Trupanion does not try to control the cost of veterinary care or increase pricing to boost profitability. They simply target spending 70% of premiums on veterinary claims for a specific pet category.
Unlike most competitors that will automatically increase pricing as a pet ages each year, Trupanion prices a pet by the age at enrollment. The expected costs of care for a pet are averaged over the life of the pet by using the age at enrollment. For example, if a puppy enrolls, the price of the policy is based on an average cost for the puppy enrolled for ages 0-13 years, while enrolling a 5-year-old dog will be based on the average cost for ages 5-13 years.
Growth in the average revenue per pet only reflects the higher average cost of veterinary care from both general inflation as well as advances in care, diagnostic tests, and more advanced treatments now available to pets. Over the last 15 years, veterinary costs have grown at an annual rate of 5-10%. Trupanion continually adjusts their subscription pricing up or down to target the 70% payout ratio. Existing members’ monthly premiums are locked-in for a minimum of 12 months from their last rate change.
Management evaluates their business and capital allocation based on adjusted operating income. They define adjusted operating income as their discretionary margin or the operating income before any costs to acquire new pets. After Trupanion pays all the veterinary invoice expenses, other cost of revenue (direct and indirect member service expenses), technology & development, and G&A, they assess what is available to be spent on sales and marketing (pet acquisition costs).
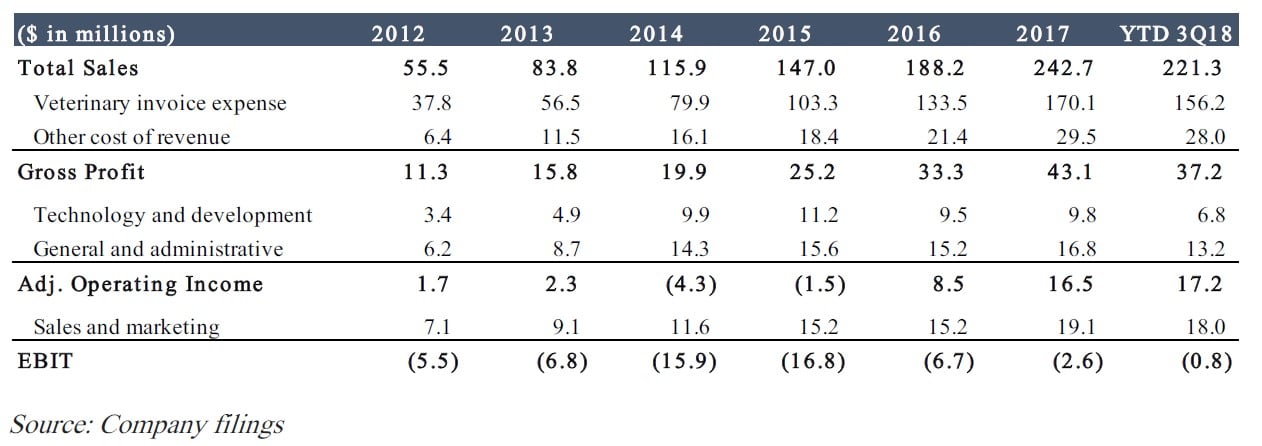
Trupanion’s cost structure is based on reaching scale, which is expected to happen when 650,000-750,000 pets are enrolled. Scale is very important for several reasons. As the number of pets enrolled grows each year, the fixed costs (technology and G&A) and certain variable costs (specifically “other cost of revenue”) decline as a percent of sales. Reaching scale is what will provide Trupanion the ability to maintain its pricing promise (paying out 70% of premiums in vet costs) as the lowest cost operator. Another significant benefit of reaching greater scale and therefore increased density in more mature markets, is the cost of acquiring new pets is significantly lower than in newer markets with fewer pets enrolled.
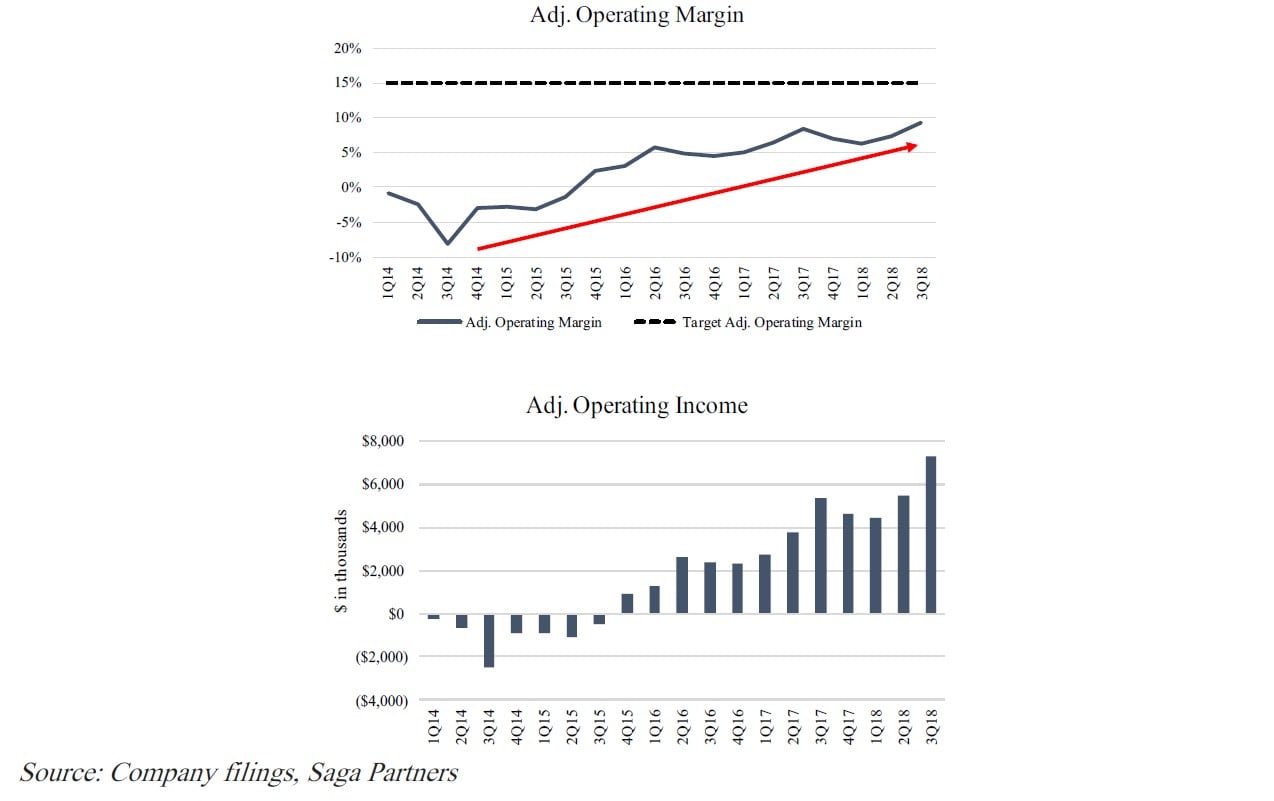
At scale, the operating margin before customer acquisition costs is expected to be ~15%.
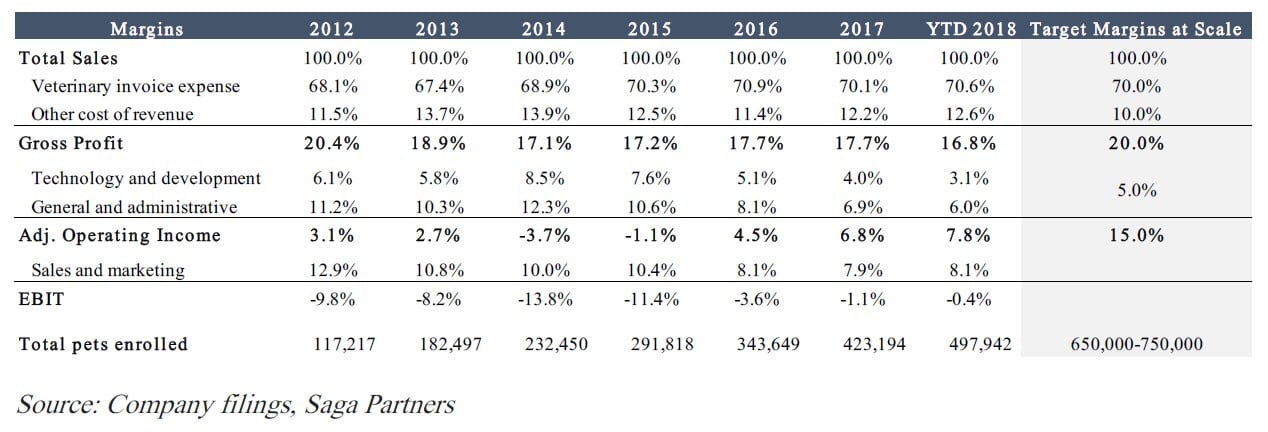
Veterinary costs are consistently around 70% of total sales each quarter.
As Trupanion gets closer to scale, variable costs (veterinary invoice expense + other cost of sales) will approach 20% and fixed costs (G&A and technology & development) will approach 5% of sales.
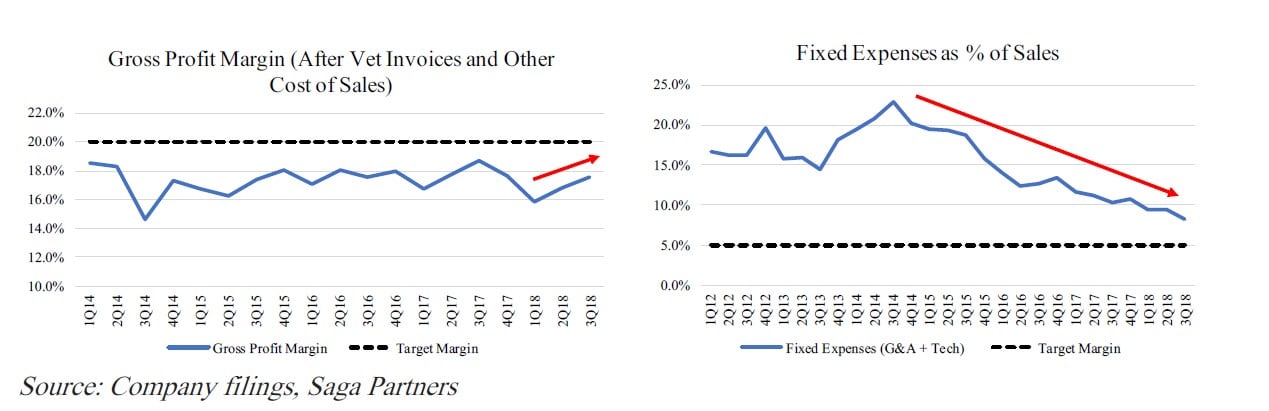
As the number of pets increase, Trupanion continues to get closer to its target adjusted operating margin of 15%.
Adjusted operating income should be viewed as a proxy for operating cash flow while pet acquisition costs are similar to capital expenditures. Each pet is an asset for Trupanion, therefore from an investment perspective, money spent acquiring the value of that asset should be amortized over the life of the asset. Trupanion’s strategy is to invest as much capital as possible, as long as they can achieve a good return on their investment. They are able to accurately predict the return on their invested capital (pet acquisition costs) because they are able to predict the lifetime value of a pet (LVP), retention rate, and contribution margin of the average pet.
As long as Trupanion is able to invest all adjusted operating income in pet acquisition costs, they will not report any earnings on a GAAP basis because all pet acquisition costs are expensed when they occur. This is a big benefit from a tax standpoint and paradoxically means that the more Trupanion can invest capital at high returns, the lower their net earnings will be, but the faster intrinsic value will grow. It’s similar to any high growth company not reporting any free cash flow in their early years as they reinvest the operating cash flow.
As Warren Buffett famously said, “truly great businesses, earn huge returns on tangible assets and can reinvest a large portion of their earnings internally at high rates of return.”
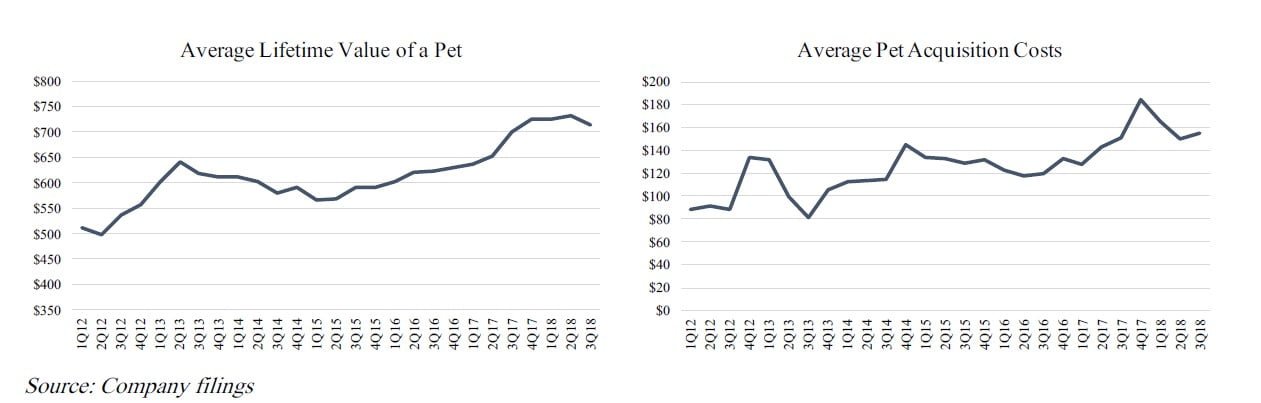
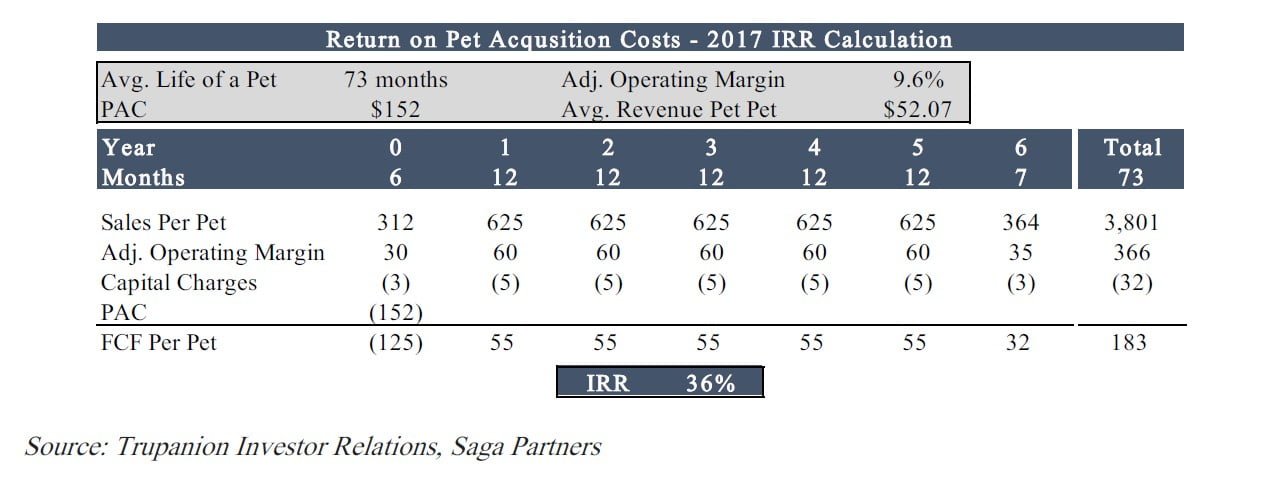
Below calculates the return Trupanion expects to make on an average pet based on 2017 numbers. It is based on the adjusted operating income they expect to earn on the average pet acquired, the expected time the average pet will be enrolled, capital charges, and the acquisition costs per pet.
In 2017, the average life of a pet was 73 months and Trupanion spent $152 to acquire each new pet. Based on an adjusted operating margin of 9.6%, the IRR was 36% on the $152 spent to acquire each new pet. In other words, Trupanion should be reinvesting every dollar they can in pet acquisition costs as long as they are able to maintain a high return on their investment.
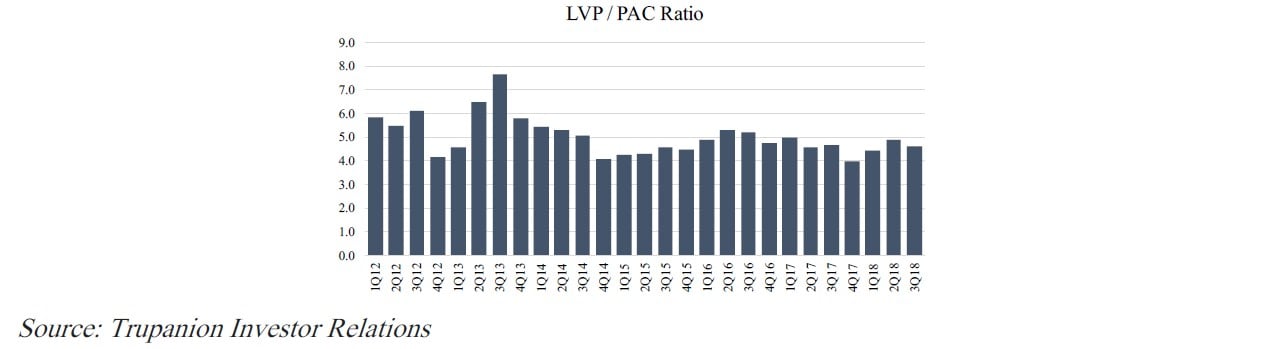
The ratio of lifetime value of a pet to pet acquisition costs (LVP/PAC) enables management to determine if they will achieve their cash flow and IRR targets. It provides a proxy to assess the return on pet acquisition costs. The lifetime value of a pet is based on the contribution margin of a pet multiplied by the number of expected months the pet will be enrolled. The higher the LVP/PAC ratio, the more value Trupanion receives for each dollar spent in acquiring a pet. Over the last five years the ratio has ranged between 4-6x, providing very attractive returns on acquisition costs.
As Trupanion scales and spreads fixed costs across more pets, the adjusted operating margin will expand and more capital can be spent on pet acquisition costs relative to the life time value of the pets while still earning a high IRR on their investment.
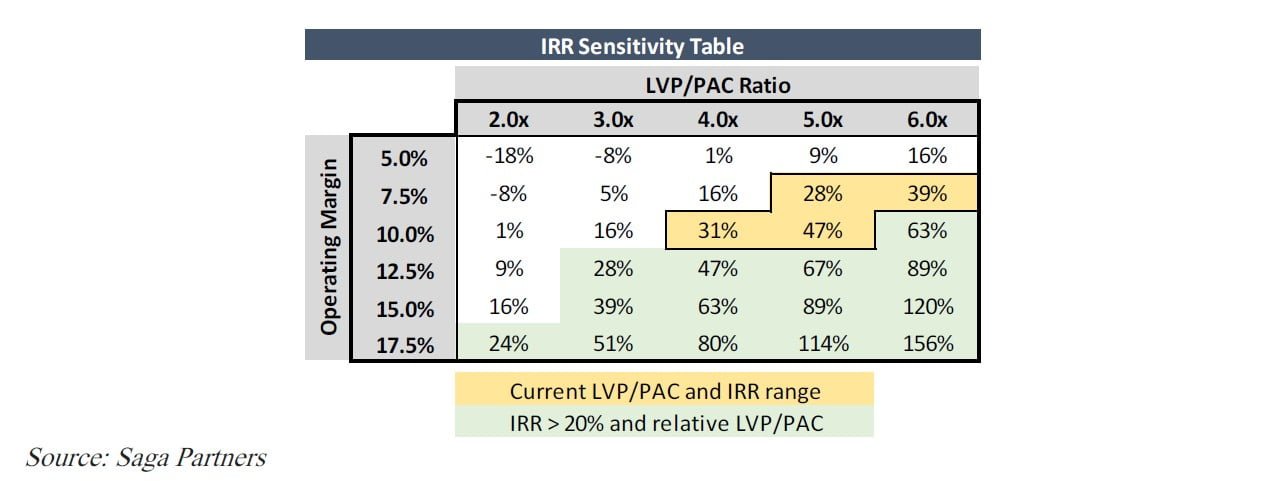
Below is a sensitivity table showing how Trupanion’s operating margin impacts the amount that can be spent on pet acquisition costs. As the operating margin increases, Trupanion is able to spend more on pet acquisition costs relative to the lifetime value of the pet and still earn a high IRR. In other words, the more profitable each incremental pet is, the more Trupanion can spend to acquire that pet relative to the lifetime value of the pet, meaning the LVP/PAC ratio can decline and the IRR will still be attractive.
The adjusted operating margin has recently ranged between 7-10% and the LVP/PAC has been between 4-6x, providing an IRR of 30-40%. With a 15% operating margin, Trupanion can have an LVP/PAC ratio of 3.0x and still have an IRR of ~40%.
Future Growth
Trupanion is in the high growth stage of its life cycle and an important question is how much more they will be able to grow. We referenced the fact that the U.S. pet insurance market is less penetrated relative to many Western
European nations. Using a 20-30% penetration rate found in more mature markets, a reasonable potential addressable market range in the U.S. and Canada is between $26 - $39 billion.
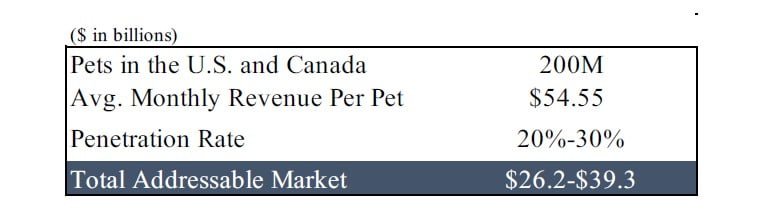
The $26-$39 billion total addressable market is a very imprecise range for the potential in North America. There are many different variables that could impact the potential market, but it gives some idea of the potential TAM. In the U.K. is took ~20 years to reach a 5% penetration rate and then another 20 years to reach 25% penetration. Therefore it took a fairly long time to reach the initial 5% penetration, but subsequent adoption grew at a much faster pace. Management believes the U.S. is at least one pet generation away (~10 years) from reaching 5% penetration rates.
Growth Drivers
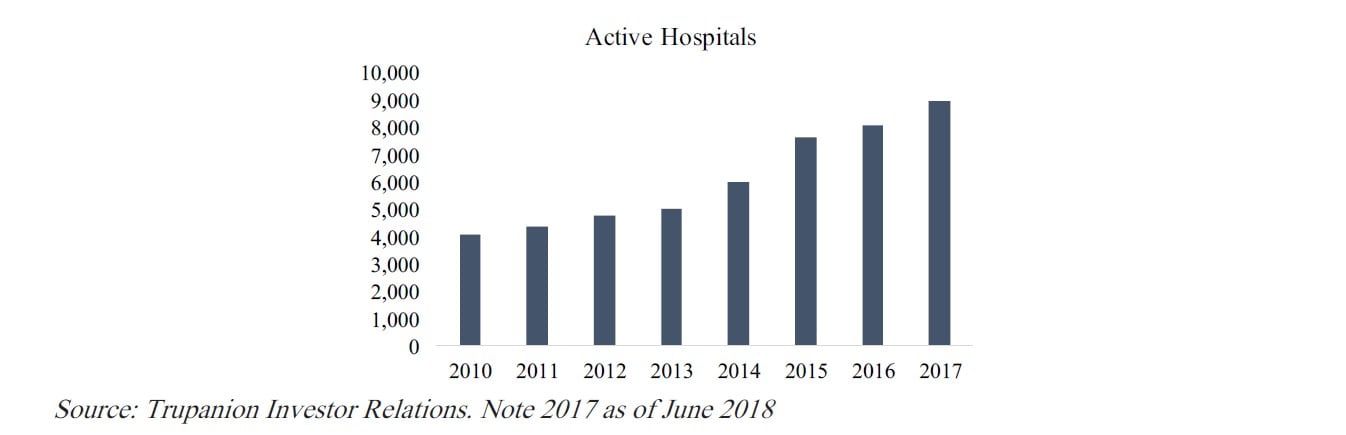
1. Number of stores: Stores are veterinary hospitals actively recommending Trupanion. This has been the key growth driver for Trupanion historically. It typically takes 2-3 years of repeated visits from Territory Partners before a hospital becomes confident in Trupanion to suggest pet owners look into pet
Trupanion had over 9,000 active hospitals as of June 2018. There are ~28,000 hospitals in the U.S. and Canada providing over 30% penetration. In more mature markets where Trupanion has been for at least 5+ years, ~50% of hospitals are typically active. ~80% of all veterinary hospitals are located within Territory Partners current geography. Trupanion’s goal is to be visiting 25,000 hospitals in the U.S. and Canada and have ~70% active, providing a potential 17,500 hospitals in the U.S. and Canada.
2. Same store sales: Growth in number of pets enrolled as a hospital. Management indicated that they have not figured out a way to accelerate SSS growth beyond what happens naturally over They have tested a few tools that may prove accretive but they are still early in their development.
3. Direct to consumer marketing: Utilizing media such as TV and radio advertisements. This is what competitors have typically used ineffectively to grow enrolled pets. Management believes that in more mature markets where the majority of vets are actively recommending Trupanion, there will be a cost- effective way to market directly to So far this has not been a big growth driver for Trupanion.
4. Pet owner referrals (reaching “nirvana”): Currently enrolled pet owners that either add another pet or tell their friends about Trupanion. This growth channel costs Trupanion $0 in customer acquisition costs. Management has a goal they call “nirvana” which is having referrals offset Trupanion’s churn rate. If nirvana is reached, Trupanion could in theory spend $0 on pet acquisition costs and maintain their current number of enrolled
Nearly 80% of referral sources (veterinary leads and existing member referrals) are not directly compensated. Most recently, pet owner referrals contributed 0.7% to monthly growth, so Trupanion is halfway to pet referrals offsetting the 1.5% churn rate.
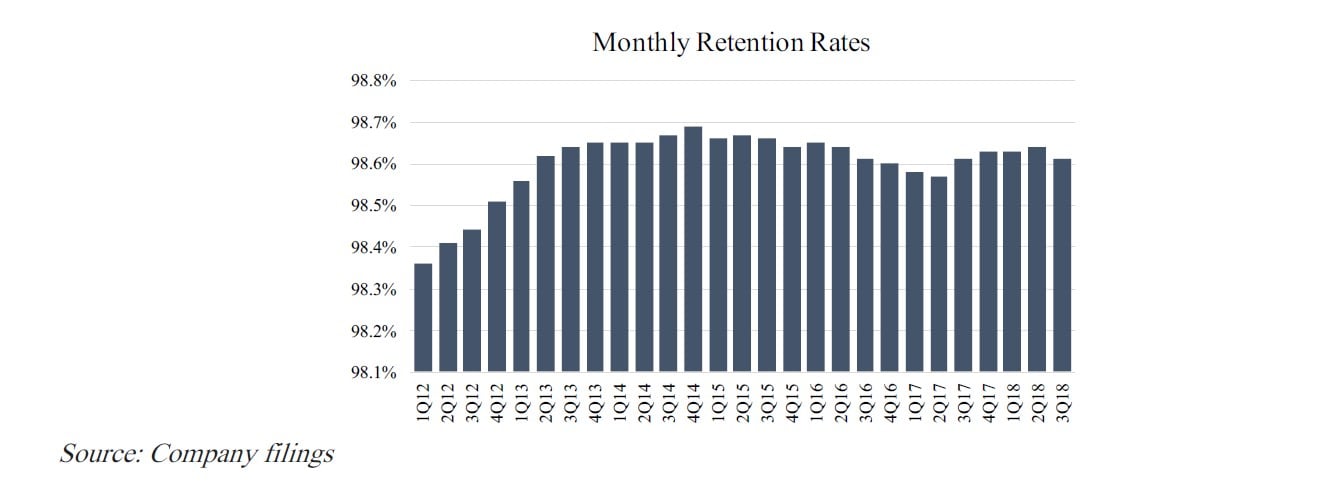
Trupanion’s monthly retention rate for the last 10 years has averaged just over 98.5%, providing ~82% annual retention rate. The company believes they have the highest retention rates of any other pet insurance provider in the U.S. Churn comes from three categories: 1. pet owner dissatisfaction, 2. loss of pet ownership (usually pet passes away or is re-homed), and 3. failed payments.
Pet owner dissatisfaction is the largest contributor to churn which often occurs within the first 90 days of enrolling. After the first 90 days, retention rates increase substantially and the average life of the pet enrolled increases ~10 years versus the ~6 years when all enrolled pets are counted. Dissatisfaction mostly occurs because a pet may have a preexisting condition that is not covered. If an older pet signs up with Trupanion, all prior vet records need to get documented which can take time to get processed if a vet needs to send them to Trupanion. Trupanion Express is attempting to improve the speed and transparency of informing pet owners if a specific preexisting condition is not be covered. Trupanion is also focused on educating pet owners to sign up puppies and kittens which have no preexisting conditions so pet owners know everything will be covered during the entire life of their pet.
5. Other revenue: Business-to-business partnerships through corporate employee benefits and veterinary employee benefits. Trupanion’s insurance subsidiary, American Pet Insurance Company, also issues policies for other brands of medical insurance for
6. New products/businesses: This could include other lines of pet insurance (i.e. fish insurance) or entering new Trupanion still has plenty of ability to grow within its existing product lines therefore this growth category will be not be relevant until the U.S. and Canada dog and cat insurance market becomes more saturated.
Valuation
Management has been very transparent about near-term and long-term goals for the company. In each of the annual shareholder letters, they outline what the company did well and needs to work on. You can go back and read what management says in past years and see what actually occurs subsequently. For example, in the 2014 letter, management said they plan on being cash flow positive by the second or third quarter of 2016, which they achieved in the second quarter of 2016.
Many Trupanion skeptics state the company is a money losing P&C insurance business and should be valued relative to book value. We agree that on the surface valuation looks expensive since there are no reported GAAP earnings and it has a price to book ratio of ~6x. However these often-used, somewhat cursory valuation proxies do not provide much insight into Trupanion’s true potential intrinsic value.
There are good reasons why financial firms are often valued relative to book value while non-financial firm value is typically based more on operating activities, often relative to some cash flow proxy. Insurers earn a substantial portion of their profits from the spread between the return on invested asset and the cost of liabilities, and their book values of asset and liabilities are typically close to fair values. Potential growth can also be limited because insurers’ capacity to underwrite is directly related to their equity capital.
At the basic level, insurance is simply pooling together premiums from customers to redistribute risk and then paying out claims. The most important job of an insurance company is estimating what the future claims will be and pricing premiums at a level to cover the claims and operating expenses to leave a fair profit for shareholders.
Trupanion’s insurance operation is not as comparable to certain other P&C insurers. Some types of insurers such as with life insurance have very long-term policies. There can be a long lag between when insurers collect premiums and eventually pay out claims. This means some insurance companies do not know their true cost of goods sold or its operating margin in a given period for several years after they report because estimates of the claims accrued for a given year do not materialize for many years into the future.
The larger the claims, lower the frequency, and more unpredictable the costs, means insurers must hold more assets on their balance sheet to prepare for potential long-tail risks. Insurers will hold premiums longer creating a lot of float, which is simply money held at the insurer but is expected to be paid out in claims. As insurers hold more assets on their balance sheet relative to their potential claims liability, they become more capital intensive and dependent on interest and investments for income.
At the end of the day the value of any company is the cash it generates. What truly matters with any asset is understanding the cash flows. Trupanion operates on a money-in, money-out basis, all within the same month, on average. Their goal is to pay claims within the first five minutes of an invoice being created. As a result Trupanion carries very little float.
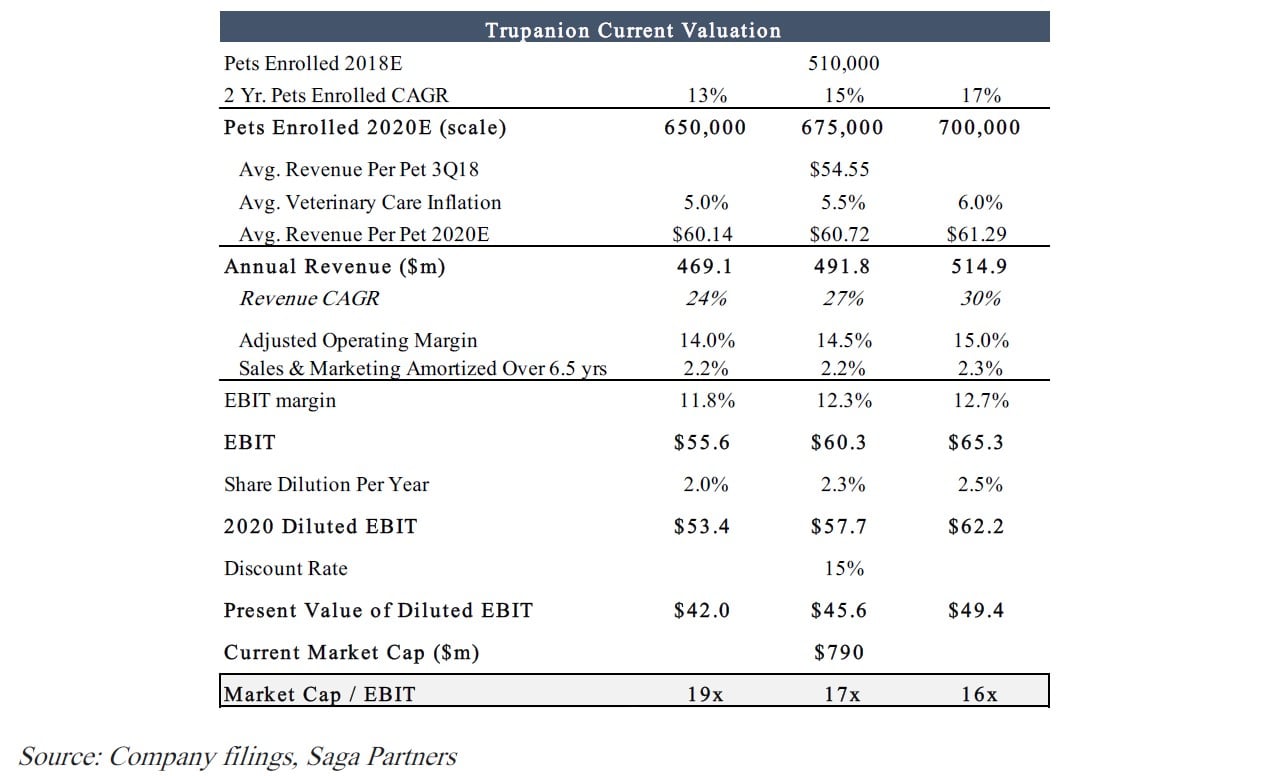
Trupanion is able to grow much faster than the average insurance company both because it is in a largely untapped market and it can accurately know what to price a premium of a newly enrolled pet to cover the average cost the pet will experience during its first month (~70% veterinary costs). Trupanion’s entire cost structure is based on what they will look like when they reach scale at 650,000-750,000 pets, at which point they should have operating margins before customer acquisition costs of ~15%. Based on historic trends and expected enrolled pets of 510K at 2018-year end, we think it’s reasonable to expect Trupanion to reach between 650K-700K pets by 2020.
Below is a model of what Trupanion’s income statement may look like in the year 2020. We assume pets enrolled grow at 12-17% CAGR, veterinary care inflation is 5-6%, and Trupanion reaches scale adjusted operating margins of 14-15%.
We assume that in 2020 Trupanion will still be able to reinvest all adjusted operating income in high IRR pet acquisition costs. Since pet acquisition costs should be viewed as capital expenditures spent on acquiring long- term assets, we amortize the adjusted operating income over the expected life of pet, or ~6.5 years.
Assuming 2.0-2.5% in share dilution, 2020 EBIT could range between $53 – $62 million. If an investor requires a 15% return on their investment (not the WACC just a general return on investment target), the present value EBIT would be between $42 - $50 million, providing a market cap/EBIT of 16-19x. We use market cap instead of enterprise value because we assume the net cash held on Trupanion’s balance sheet is required for operating purposes. As of 3Q18, Trupanion has $74 million in cash equivalents and $8.6 million in debt. Cash equivalents held on the balance sheet is to cover expected claims (reserve for veterinary invoices was $14.2M at 3Q18).
A 16-19x EBIT multiple looks very attractive considering Trupanion has a long pathway ahead for growth, with the ability to reinvest cash flow at 30-40% IRR and continue to grow sales between 20-30%.
The market can underappreciate the value of a truly high-quality company that has the ability to reinvest earnings at a high rate of return for many years into the future. Amazon is a good example of this kind of business. If you go back just 15 years, Amazon was trading for a market cap of $21 billion and had sales and earnings of $2.3 billion and $4 million. If you bought shares in 2003 for $50 and held them today, you would have earned a 25% compounded return. Let’s say in 2003 you required a long-term IRR of 15% on all your investments (far above the 7-8% S&P 500 CAGR provided over the same time). Amazon’s fair value to an investor would have been about $200 per share or 4x the price. $200/share would have valued Amazon at $84 billion or 37x its 2003 sales.
Other great 20%+ compounders like Google, Facebook, or Berkshire Hathaway, were historically undervalued much of the time because the market underweighted their compounding power. Of course hindsight is always 20/20 and we are not claiming Trupanion is the next $1 trillion market cap company, but it does show how the market can undervalue companies that have the ability to reinvest capital at high returns for many years into the future.
There are few long-term compounder companies, so if you get conviction you have found one, we suggest buying shares and holding on to them for the long-haul. Wall Street analysts typically don’t look much farther than two years out when valuing a company. Trupanion skeptics are very focused on how the financial statements look today, ignore their growing competitive advantage, long-term trends in the historic results, and disregard what the company will likely look like in 10+ years.
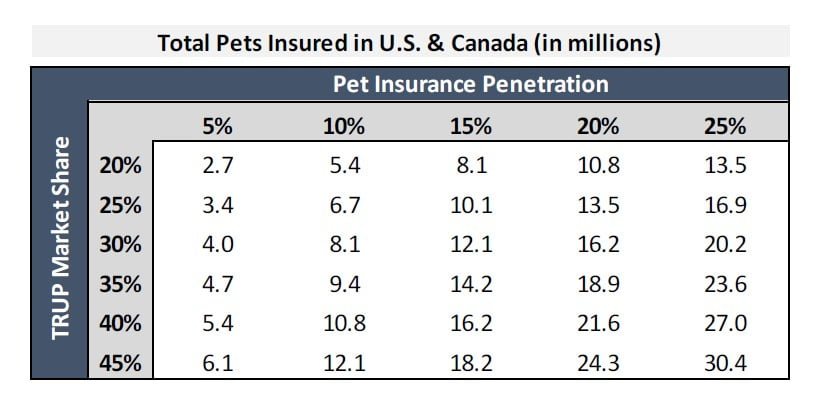
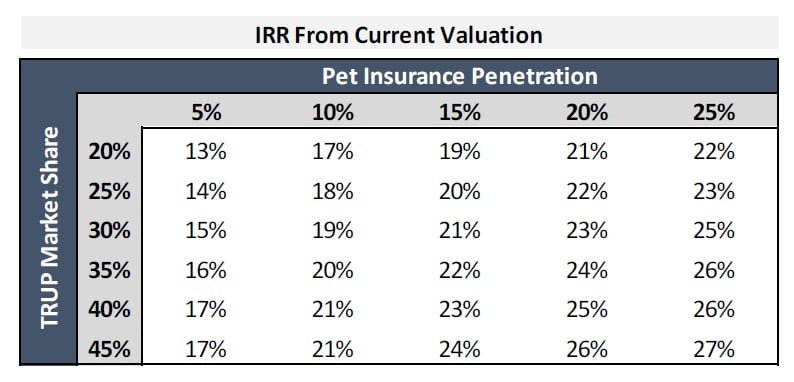
Below are sensitivity tables showing what Trupanion may look like 20 years out in 2038. There is huge margin for error when looking out 20 years, but if you believe Trupanion is building a durable moat in a large underpenetrated market, we think these scenarios are within a reasonable range of expectations. If you do not think Trupanion has a defensible moat and provides an undifferentiated, low margin product, it’s probably best to look no further.
We assume the 200 million dog and cat population in the U.S. will grow inline with historic rates of 1.5% annually, providing 270 million dogs and cats in 2038. Regarding U.S. & Canada pet insurance penetration, management believes the U.S. is at least one pet generation away (~10 years) from reaching 5% penetration rates. If the U.S. follows a similar trend as the U.K., once it hits 5%, growth in penetration may accelerate in the subsequent decade. We think a 5-25% penetration rate in the year 2038 is a reasonable range. Trupanion’s current market share is ~30% and its market share of newly insured pets is closer to ~40%, therefore we assume future market share between 20-45%. Based on the assumptions below, Trupanion will enroll between 2.7-30.4 million pets in 2038.
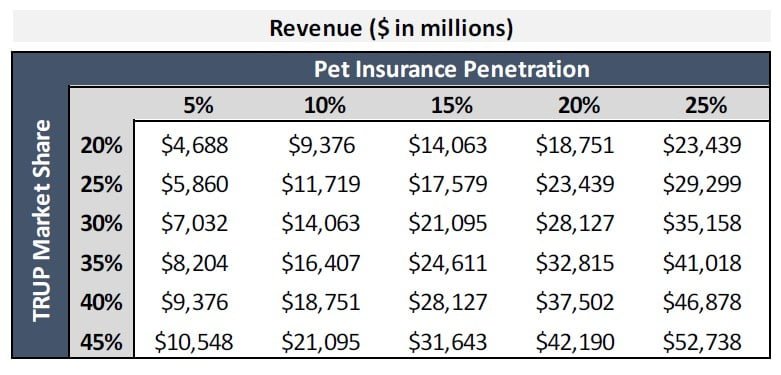
Assuming a 5% CAGR in average revenue per pet over the next 20 years, (at the low end of the 5-10% historical average veterinary care inflation over the last 15 years), the average monthly revenue per pet will grow from the current $54.55 to $144.74 in 2038, providing a revenue range of $4.7-$52.7 billion based on the sensitivity scenarios.
Assuming a margin of 15%, Trupanion’s adj. operating income would be between $703 million - $7.9 billion.
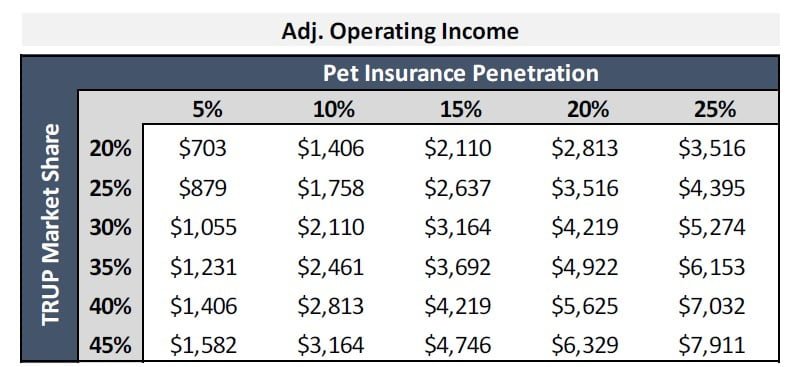
Note that adj. operating income is before sales & marketing costs to acquire new pets. There is a chance that Trupanion reaches “nirvana” where they could spend $0 in customer acquisition costs and maintain the current number of enrolled pets, meaning all adj. operating income could drop to the bottom line after paying interest and taxes if no attractive investment were available. It is reasonable to expect that Trupanion will not be able to invest at such a high IRR on pet acquisition costs since the market will be more saturated.
For valuation purposes, let’s assume that Trupanion can not find any attractive investment opportunities in 20 years and adj. operating income is available to shareholders after paying interest expense and taxes. Putting a reasonable 12x market cap/EBIT multiple on 2038 adj. operating income provides an enterprise value range between $8.4-$95 billion. This is a very wide range which makes sense given the uncertainty looking 20 years out. This growth also does not consider Trupanion expanding into related business lines (i.e. fish insurance) or expanding outside the U.S. and Canada. Often when investing in high quality companies there can be positive surprises over time (such as Amazon unexpectedly moving into AWS), while lower quality businesses often have negative surprises.
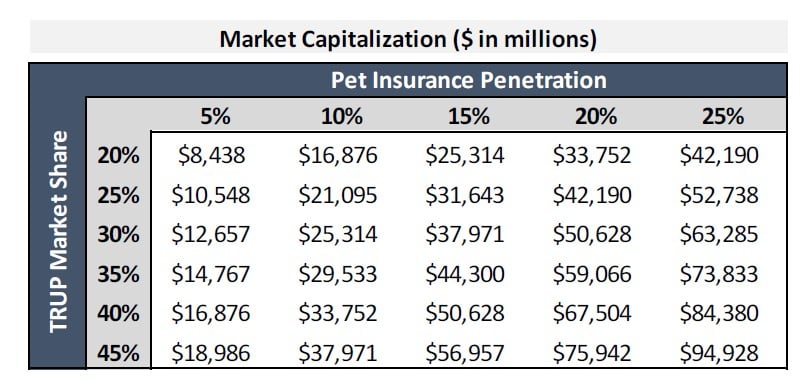
Based on the current market cap of ~$790 million, the expected returns for the given scenarios range between a 13-27% CAGR over a 20-year period. An investor should probably lower the expected CAGR by ~1-2% annually to account for share dilution, providing an 11-25% CAGR.
Earning an 11% CAGR over the next 20 years vs. earning 25% CAGR will provide significantly different results however we think it shows the substantial return potential for a strong long-term compounder company.
Risks
1. Execution: Trupanion is in the very early stages of their development and disrupting an industry that is largely untapped. While Trupanion’s trends look strong, they have to continue building their competitive advantage. Competition was not historically very strong and it is reasonable to expect other companies to try and emulate Trupanion’s product and business model going forward. While we think the cards are stacked in Trupanion’s favor, they still have to execute by sticking to their pricing promise and providing the best valued product to both customers and supporting
2. Regulatory Risks: There has been a lot of attention recently on Trupanion’s regulatory matters. The concerns surround the fact Territory Partners are not licensed to sell insurance. Trupanion has licensed agents that sell their products direct to pet owners through their 24/7 call center or online. Trupanion claims that Territory Partners do not sell directly to customers unless they chose to be licensed Their role is to build and support relationships with veterinarians. The grey area is how Territory Partners are compensated.
According to regulators, “an insurance agency may pay a fee to a non-licensee, non-employee for making a referral provided that the non-licensee does not discuss the specific terms and conditions of the policy, and the fee paid is not dependent upon whether the referral results in the sale of insurance.”
Territory Partners are compensated by a combination of referral fees for new pet enrollment and residuals tied to pet retention within their territory. Their fee compensation is the same flat amount without regard to how the customer enrolled. Trupanion claims they have ongoing discussions with regulators relating to their business practices and no state regulatory agency has ever reached any conclusion that has or is expected to have a material impact on their business.
We are not experts in regulatory law or policy, however let’s say regulators determine that Territory Partners must become licensed. It costs a few hundred dollars and typically a few weeks at most to study and pass the insurance licensing exam. It would hardly be a big impact to Trupanion’s business model if regulators determined that the 100+ Territory Partners needed to get licensed.
A worse scenario would be if regulators found that Trupanion knowingly supported bad business practices and then got fined a material amount of money. From what appears to be ongoing and constructive conversations with regulators, we think it is unlikely Trupanion would face significant penalties.
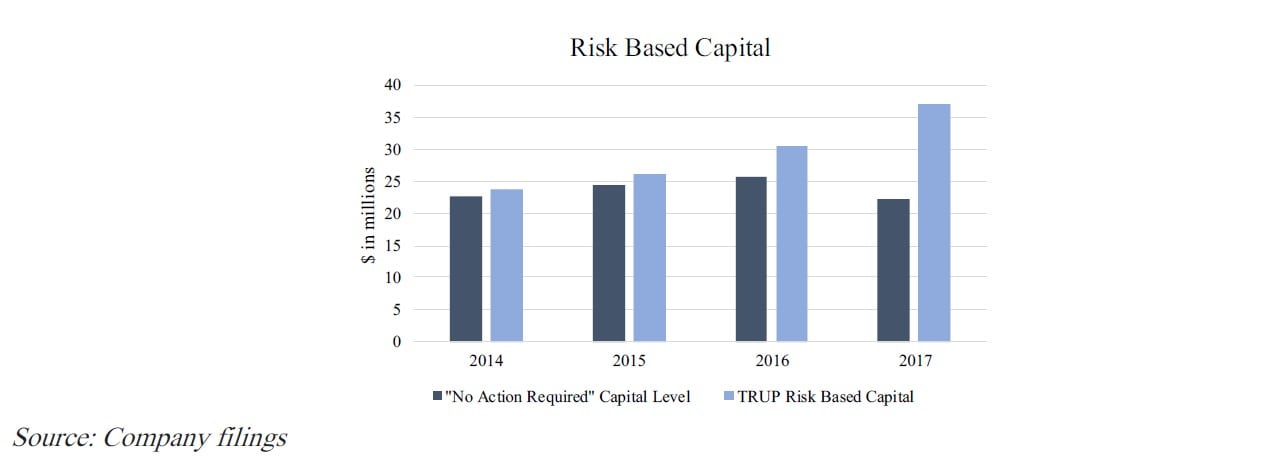
3. Equity Raise: In July 2018, Trupanion issued 8 million shares at $33 to acquire the $65 million building it was leasing. There was some concern among investors that issuing equity at a below market price at the time (shares were selling for ~$40/share), may not have been the best source of capital. Management had stated in their 2016 letter, “paying up front for assets that would sit on…balance sheet and help lower ongoing frictional costs.”
Our main question was why Trupanion did not issue debt to purchase the building. Trupanion’s investor relations provided us with more color stating the equity raise was because regulators approved 10% of the equity in the building ($7.5 million) to be considered in Trupanion’s risk-based capital requirements, therefore freeing up $7.5 million that could be used for higher returning investments (PAC). Over the next 12-15 years it will free up ~$60 million of capital. Additionally purchasing the building in itself lowers fixed expenses by $3M-$5M per year in lease savings and rental income.
From a capital standpoint, Trupanion is subject to risk-based capital regulations that require it to maintain certain levels of surplus capital to support the overall business operations in consideration to their size and risk profile. To be fully compliant with a regulatory “no action level” status, insurer’s total adjusted capital must be equal to or greater than 200% of insurer’s estimated capital adequacy.
Conclusion
Trupanion is a high-quality company building a durable competitive advantage with long-term compound growth potential. It has a strong lead relative to competitors as the low-cost operator. As the company reaches operating scale over the next 2-3 years, adjusted operating income will accelerate while still having numerous opportunities to reinvest capital at high returns into the foreseeable future.
This article first appeared on ValueWalk Premium


