
In our October 2017 article, we highlighted our view that investors in Indian equities were being exuberant. To depict the extent of investor exuberance, we looked at the valuation of our basket of high quality businesses; the India Moats Index (IMI). The IMI is comprised of Indian businesses that in our view possess durable competitive advantages It includes businesses across the market capitalization spectrum and is diversified across sectors and industries. As we discuss in the warning signs section below, valuations were indeed in extreme territory.
Such instances of investor exuberance usually resolve themselves in poor investment outcomes. The investment experience of past few years leading up to January 2018 bred complacency among market participants, resulting in an increased willingness to pay elevated prices and a higher tolerance to any business quality or corporate governance related issues. As any shopper with slightest of smarts will tell you, it is a foolish to acquire something at a price substantially above it value. However, it is downright stupid when the object being acquired is of questionable quality.

Q4 hedge fund letters, conference, scoops etc
In the first instance, your success depends on the ability to find greater fools willing to pay even higher prices. In the second instance though, the only option is to head for the prayer room and hope for a miracle. Clearly, not a viable strategy. Interestingly though, that is exactly the game that was prevalent when we suggested exercising prudence.
The Mini Bear Market of 2018
Between January 2018 and February 2019, the NIFTY 50 index was down by -1.5% while the BSE Sensex was down -0.3%. Both these headline indexes give no indication of the painful investment environment experienced in that period. Consider that while the headline equity indexes sported a flat investment outcome, the broader equity market was in the midst of a mini bear market with the S&P BSE Midcap index declining by -17% and the S&P BSE Smallcap index declining by -27%.
This was also reflected in investment results of mutual funds based in India and focused on India equities. We looked at the performance of 689 equity mutual funds in India. The average performance of these funds was -5.6% for the calendar year 2018[1]. Not surprisingly, results were much worse for mid-cap and small-cap focused funds. The average result of the 75 mid and small cap focused funds for which we were able to access data was -13.4% for 2018[2].
In the rest of this article, we will look back to see if there were any warning signs that were present leading up to this mini bear. Additionally, by segregating the performance of small and midcap businesses within the IMI, we provide an apples-to-apples comparison of the performance of our high quality businesses with the overall small and mid-cap segment of the market.
Warning Signs - Elevated Valuation Levels
In our article referenced earlier, we looked at the valuation of IMI based on multiple valuation tools including the price to earnings ratio and the price to book ratio. Importantly, we looked at the valuation of the index in relation to our estimate of intrinsic value of each one of the businesses included in the index. Figure 1 is a reproduction of the price to intrinsic value chart from the article. As is seen, valuations were indeed extreme.
What Figure 1 shows is that investors were willing to pay much higher prices for businesses than they were likely worth. While paying more than the value you get is never a good investment practice, it is important to note that when paying up for high quality businesses, the primary risk that the investor runs is a subpar investment result in the intermediate term. With the passage of time though, business value of the portfolio will grow and catch up to the price paid. The primary assumption being that the businesses acquired were truly wonderful businesses. As Warren Buffett said, time is the friend of the wonderful business.
Figure 1: India Moats Index, Price to Intrinsic Value
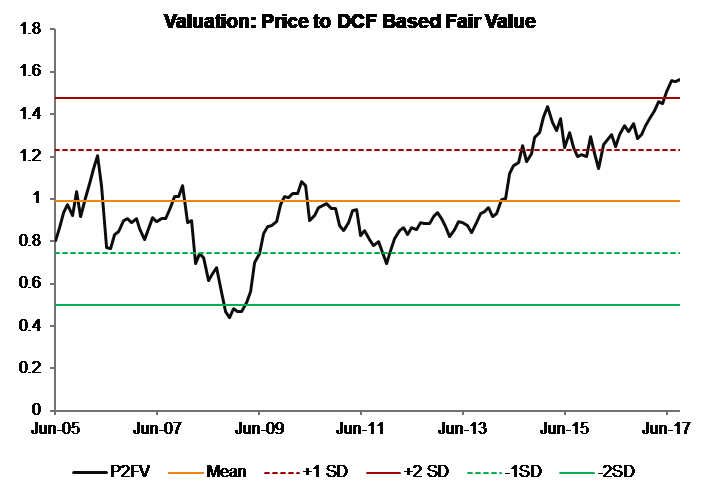
Source: Sapphire Capital Advisors[3]
Investor Exuberance - Extreme Valuations in Small and Mid-Cap Segments
However, during periods of investment euphoria, investors don’t just bid up the prices of good businesses. Instead, such periods are associated with significant mispricing of risk. The result of such mispricing is that poor quality businesses become subject of significant buyer interest. In our experience, it is the poor quality assets that end up becoming significantly more overvalued than their high quality counterparts.
It was no different this time around either. In our Q1 2017 letter to the investors of India Moats Fund[4], we asserted that the mid and small capitalization segment of Indian equities were extremely overvalued. Figure 2, reproduced from the letter, showed the median price-to-earning ratio (PE) for the NSE mid and small cap indices. As is seen, the median PEs for both these indices were at +2 standard deviation levels. Indeed, the median PEs were higher than they were in 2007 - 2008.
Figure 2. Median Price to Earnings Multiples for NSE Midcap and Smallcap Indexes

Source: India Moats Fund[5]
A Tale of Two Markets - Investors Take Small Caps for a Ride
In our Q2 2018 letter to the investors of India Moats Fund, we showed that between 2014 and 2017, market participants painted the small capitalization businesses with a very different paintbrush. Figure 3, as reproduced from our letter, showed the performance of market capitalization weighted indexes across the three capitalization segments[6]. As is seen, the smaller capitalization businesses broke away from their larger counterparts in 2014.
Figure 3. Performance of India Equities Segmented by Market Capitalization

Source: India Moats Fund[7]
Importantly, this runup wasn’t supported by fundamental performance of the businesses. Figure 4 showed the price to book value ratios for small and mid-cap indexes depicted in Figure 3. As is seen, price to book value ratios for these indices were the highest they had been outside of the bull market of 2000s.
Figure 4. Price to Book Value Ratio for Mid and Small Capitalization Businesses
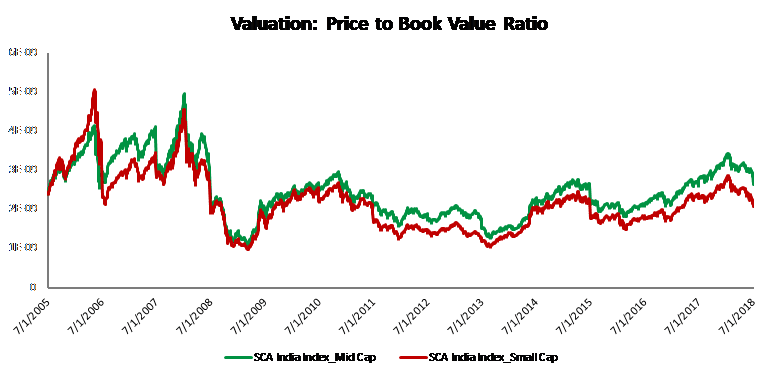
Source: India Moats Fund[8]
The Aftermath - Yet Another Tale of Two Markets
What transpired over the course of the last twelve or so months was pretty much what one would expect. No miracles took place. Those who acquired mediocre businesses and paid a high price for them suffered significant losses. As the euphoria itself was largely concentrated in the mid and small cap segments, that is where much of the pain was felt as well.
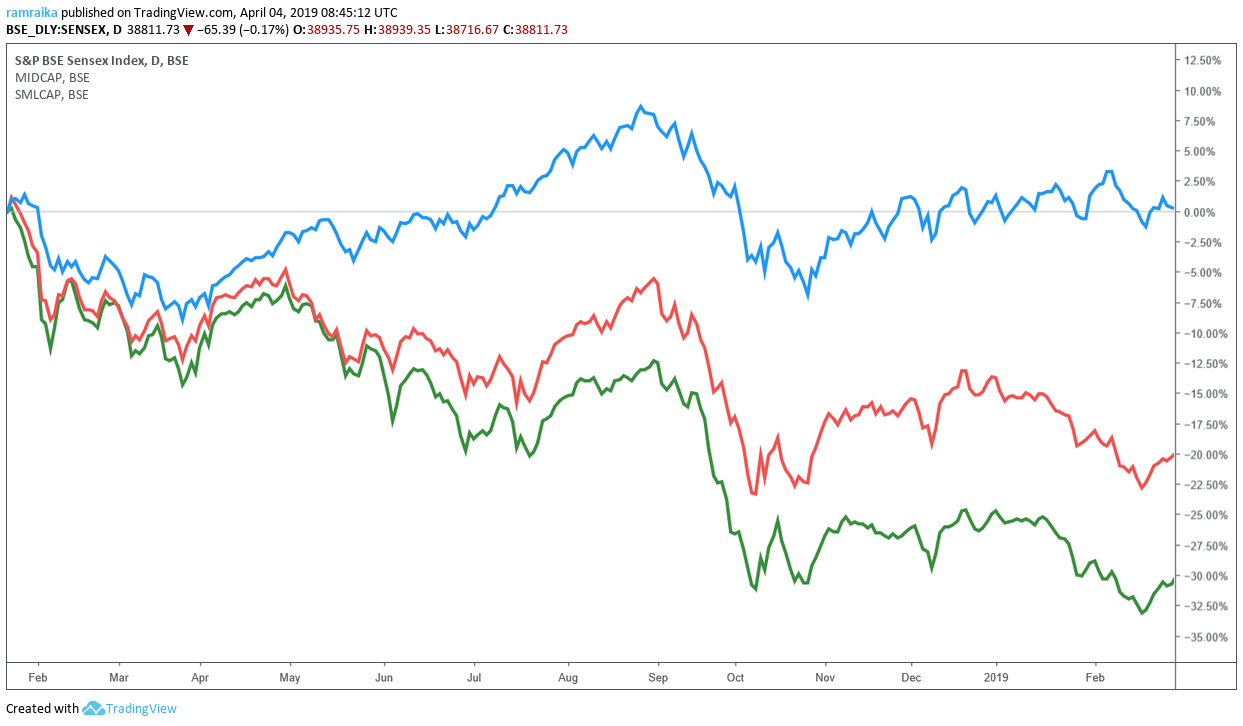
As discussed earlier, the S&P BSE Midcap and Smallcap indexes declined by nearly -18% and -27% respectively. Figure 5 shows the performance of the S&P BSE Sensex, the Midcap index, and the Smallcap index between January 2018 and February 2019. As is seen, smaller sized businesses suffered significant losses.
Figure 5. Performance of the Sensex, the Midcap index, and the Smallcap index
Performance of High Quality Stocks vs Overall Markets in Testing Times
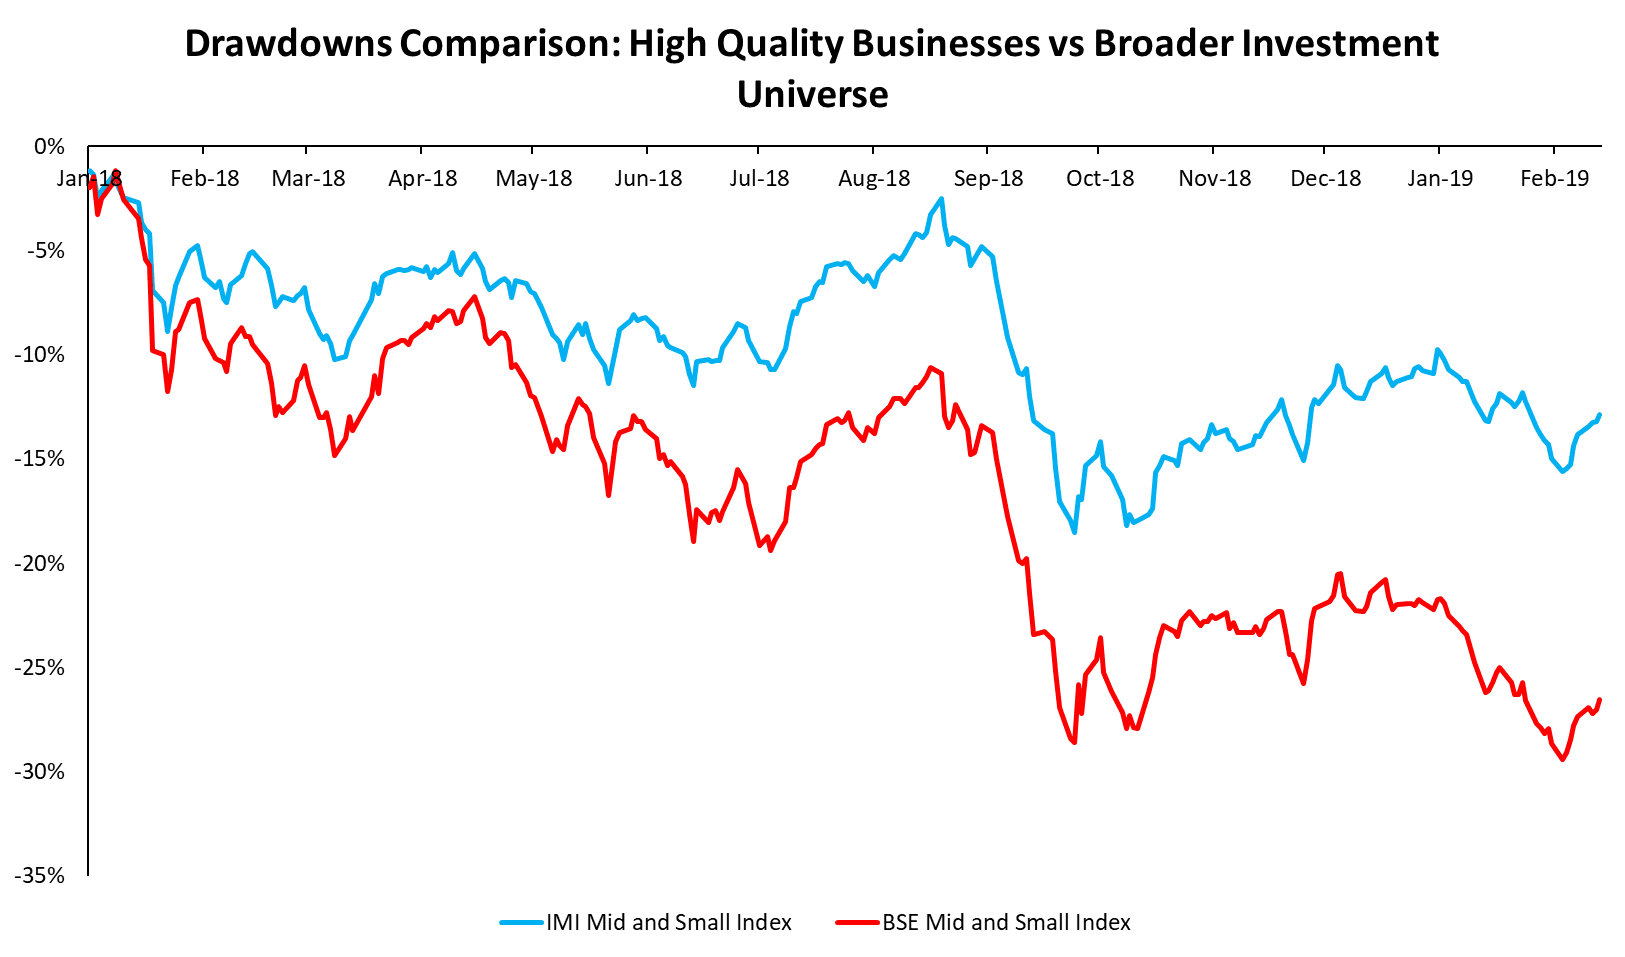
So how did the high quality stocks perform during this time period? To provide for an apples-to-apples comparison between the performance of the India Moats Index and that of the midcap and smallcap segment of the Indian equity markets, we segregated the IMI into the three market capitalization segments, namely, large-caps, mid-caps, and small-caps. Of the 65 businesses that are a part of the IMI, 43 qualify as mid and smallcap businesses.
We then constructed an equal weight index comprised of these 43 businesses, shown in Figure 6 as IMI Mid and Small Index. Lastly, we took the S&P BSE Midcap and Smallcap indexes and created a blended index with a 50:50 mix[9], shown in Figure 6 as BSE Mid and Small Index.
Figure 6 shows the performance of the mid and small cap businesses comprised within the India Moats Index and compares their performance against that of the BSE mid and small cap segments between January 2018 and February 2019. As is seen, our basket of high quality businesses registered a significantly smaller decline.
Figure 6. Performance of the IMI Mid and Small Index vs BSE Mid and Small Index
Summary
An important element to keep in mind is that over extended investment horizons, investment returns are driven by business value growth. In the short and intermediate term though, they are aided by expansion of valuation multiples. While high quality businesses experience significant business value growth with passage of time, investment performance of mediocre business is largely a matter of changes to valuation multiples as such businesses experience sub-par to negative business value growth.
The rising tide lifts all boats. However, when it recedes sharply, the lower quality boats are left shattered. It is the high quality ones that continue to remain afloat. In our view, in the endeavour of investing, staying afloat is significantly more important than rising to the highest level along with the rising tide. It is this thinking that is at the core of our investment philosophy of investing only in a subset of wonderful businesses.
Article by Baijnath Ramraika, CFA, Prashant Trivedi, CFA, and Chetan Gindodia
Footnotes
[1] Source: https://www.valueresearchonline.com/funds/fundSelector/returns.asp?cat=equityAll&exc=susp%2Cclose&rettab=ann [2] Source: https://www.valueresearchonline.com/funds/fundSelector/returns.asp?cat=103%2C104&exc=susp%2Cclose&rettab=ann [3] https://www.symantaka.com/india-equity-market-valuations-need-for-prudence/ [4] India Moats Fund is an India focused fund that invests in a carefully selected basket of moat businesses operating in India. [5] Quarterly investor letter, Q1 2017, India Moats Fund [6] The indexes were rebalanced once a year in July with largest 500 businesses selected and segmented into the large (largest 100 businesses based on market capitalization), mid (businesses ranked 101 to 250 on market capitalization), and small cap (businesses ranked 251 to 500 on market capitalization) segments. [7] Quarterly investor letter, Q2 2018, India Moats Fund [8] Quarterly investor letter, Q2 2018, India Moats Fund [9] The blended index is rebalanced once every quarter to 50:50 weight.


