
Dear fellow investors,
We remember looking at demographic charts back in the 1990s which compared the population of the peak borrowing age group (28-40) with the peak savings age group (49-62). At that time, 10-year Treasury bonds were still yielding 7.5-8% and investors wondered where interest rates were going. As we look at the chart below, you can see that when baby boomers moved from peak borrowing (around 40 years of age) to peak saving age (around 58 years old), their sheer numbers would cause interest rates to plummet.
Source: Fundstrat, “The Long Game,” 2019 Strategy.

Q4 hedge fund letters, conference, scoops etc
And boy have they ever plummeted to today’s rates around 2.5 to 3%. When 79 million savers replaced 44 million savers, the supply of savings increased massively. When 66 million borrowers replaced 79 million borrowers, the demand for borrowing went down. When supply goes way up and demand declines, prices fall. The interest rate is the price of money. Here is the chart of interest rates from March 1, 1994 to today:
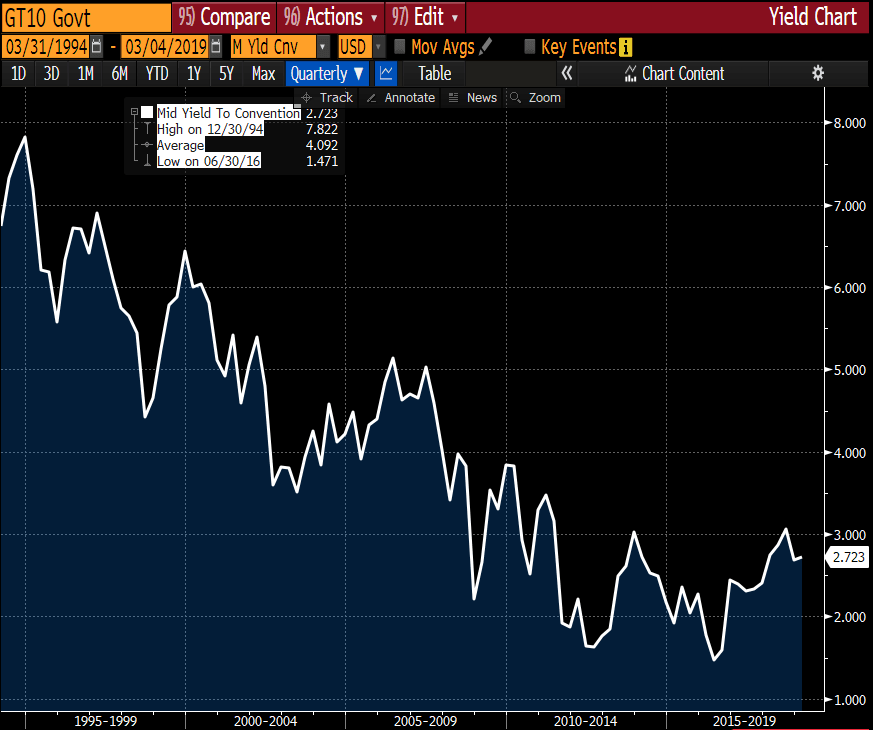
Source: Bloomberg.
There are 74 million baby boomers leaving the savings mode in retirement, who are being replaced by approximately 66 million Gen-X savers in the peak income years. Those 66 million former borrowers are being replaced by 95 million borrowing-age millennials between now and 2038. Just do the math! This is almost exactly the opposite circumstance to 1994. Is it different this time or are rates headed higher the next 10 to 15 years?
How do rising interest rates affect long-duration common stock ownership? First, interest rates go up because capital is being demanded. Historically, mortgage debt makes up 70% of U.S. household debt. Therefore, the primary driver of rising interest rates is household formation. When 96 million people want a home and they are replacing 66 million who came through before them, home building and renovation become an extremely popular industry and sector.
Second, when demographics create economic growth and capital gets significantly more expensive, investors shift their focus from craving hard to come by revenue growth and move to the secular tailwind behind profitable companies who meet the demographic-demanded products and services. Earnings and free-cash flow growth replace price-to earnings (P/E) ratio expansion as the driver behind stock price movements.
Third, overall P/E ratios decline as capital moves from stocks desired in an anemic economic growth era, to actual Main Street business activities. Not only is capital demanded for household formation, but states and municipalities require capital for infrastructure as families create new neighborhoods and fill schools with elementary students. Expectations for inflation rise as more people demand goods and services attached to household formation. History shows that P/E ratios are inversely correlated to inflation and interest rates.
We at Smead Capital Management are very aware that the current stock market is ignoring these long-term and ultimately obvious demographic shifts. Popularity is found in e-commerce, social media, artificial intelligence and data analytics. Why would a firm like ours, which has done well over our 11 years of existence, run the risk of missing out on short-term rewards for long-duration success?
The answer is simple, and it is attached to very basic math. This demographic shift should well be the size of a tsunami and could last for ten years or longer. To make money from a ten-year tsunami wave, you need to be out in the surf long before the big wave hits. Most portfolio managers and indices will be caught on the beach with a smallish surfboard. Ironically, since January 1, 2017 to today, we have given up very little net return to the S&P 500 Index, even though investors have ignored the demographic math and chased exciting revenue growth stories.
Who wins when borrowing rises, the economy strengthens, and interest rates rise? Banks were big winners in the 1960s when this happened. Home builders soared in the 1970s as inflation fears motivated buyers to defend their housing cost by owning. Sellers of home goods, kids apparel, and materials related to house and home flourished. Based on the demographic math, our analysis sees long-term bonds and growth stocks as the losers going forward.
Our surfboard is big. We hold large stakes of some home builders and home repair companies such as NVR Inc. (NVR), Lennar Corp. (LEN) and Home Depot (HD). We believe in some of the nation’s largest banks who already have millennials tied into the technology they offer, like American Express (AXP), Bank of America (BAC), JPMorgan (JPM) and Wells Fargo (WFC). Our consumer discretionary holdings are pointed toward household formation and family operation, including Target (TGT), Discovery Communications (DISCA), Disney (DIS) and Comcast (CMCSA).
Robert Rodriguez, the retired CEO of FPA, has said, “to outperform the stock market you must be willing to hold an unpopular position which could cost you in short-term performance for the purpose of outperforming in the long run.”
We believe that in ten years, investors and investment experts will look back and say that there wasn’t any way to know what we are explaining could happen. They will be condemning the Fed and policy makers for not getting in front of this tsunami. The truth is that it is simple demographic math which they are ignoring.
Warren Buffett said on TV recently that he is surprised that home building hasn’t picked up more and wondered if it is a more permanent cultural shift. He’s right that the borrowing age is older than in prior generations. Remember, investors were afraid to buy long-term bonds in 1994, even though a demographic shift would unfold to make bond holders wealthy the last 25 years. We think Mr. Buffett won’t have to worry about a cultural shift as this wave crashes through the stock and bond markets the next ten years. As for us, we’ll just do the math!
Warm regards,
William Smead
The information contained in this missive represents Smead Capital Management's opinions and should not be construed as personalized or individualized investment advice and are subject to change. Past performance is no guarantee of future results. Bill Smead, CIO wrote this article. It should not be assumed that investing in any securities mentioned above will or will not be profitable. Portfolio composition is subject to change at any time and references to specific securities, industries and sectors in this letter are not recommendations to purchase or sell any particular security. Current and future portfolio holdings are subject to risk. In preparing this document, SCM has relied upon and assumed, without independent verification, the accuracy and completeness of all information available from public sources. A list of all recommendations made by Smead Capital Management within the past twelve-month period is available upon request.
©2019 Smead Capital Management, Inc. All rights reserved.
This Missive and others are available at www.smeadcap.com.


