
Madera Technology Master Fund commentary for the fourth quarter ended December 31, 2018, titled, “I’ve Done My Sentence, But Committed No Crime.”
Dear Partner,
Madera Technology Master Fund returned 37.7%
I’ve paid my dues, time after time
I’ve done my sentence, but committed no crime
And bad mistakes, I’ve made a few
I’ve had my share of sand kicked in my face
But I’ve come through
Freddie Mercury, Queen, “We Are the Champions”

Q4 hedge fund letters, conference, scoops etc
Happy new year to you and your families. With the new year, we celebrate Madera’s 5-year anniversary.
Queen’s “We Are the Champions” can serve as the anthem for much of the next generation software landscape. Being software engineers by training and trade, and having invested in software since 1995, we have seen this time and time again. Software is one of the best business models in the world with tremendous immediate value delivered to customers, limited upfront fixed costs, 99% incremental margins, enduring recurring revenues, high barriers to entry, and extremely rich free cash flow returns. Yet, during initial stock market wobbles, stocks of even the best companies get sold as correlations go to one. This happened in 4Q18. We are there to pick up the pieces.
The Master Fund delivered a positive return in 2018 amidst one of the worst periods for global equity markets since the Great Depression principally because of the portfolio’s strong esoteric assets that have driven a 0.14 correlation to the S&P 500. For comparison, the Global Hedge Fund Index lost 6.7% and had an extremely high 0.87 correlation to the market. We strive to fulfill our mission of producing long-term returns monetizing technology disruption with low correlation, allowing you to enjoy exposure to the best technology assets without being subject to the uncontrollable and occasionally manic whims of the market.
If there is one thing we can advocate to investors, it is to own the best esoteric assets with low correlation.
Our JSTARS data science platform is instrumental in helping us connect the dots, illuminating truth, and eliminating the noise. If we can source hard data showing the reality of units, price, and cost, for example, we can remove uncertainty and turn an educated hypothesis into known fact. We then worry less about stock market declines and utilize weaker stock prices to buy good assets for cheap. In the fourth quarter, we used our datatelligentTM process to home in on the esoteric assets delivering strong returns uncorrelated to the broader market and took advantage of the price dislocation. Having that clarity to know what the best assets are when the market is panicking is enlightening and refreshing. As we look forward to 2019, we continue our singular focus on monetizing the significant disruption brought by new technologies.
It pays to find the best
The fourth quarter was well rounded with each portfolio asset playing its part:
- Overall, we were fairly quiet with the portfolio through the quarter
- We made a conscious decision to reduce gross exposure in September, luckily ahead of the market fall out, as our JSTARS data had started turning over in July/August
- That allowed us to take advantage of the market decline and scoop up really good assets on the cheap in December. The best secular growth assets dislocated to at or below takeout valuations and that makes no sense when the companies are growing 30%-150% annually
- Our core portfolio companies had great quarterly earnings and as they reported investors really gravitated to them
- We also effectively hedged out the risk to our largest positions in a tax efficient manner and those hedges made money
- There was an event around one of our companies that we have been waiting for and working on for about two years. We aggressively utilized derivatives around that event to create an asymmetric return structure. The event ended up being a surprise to most and the stock had a sizable move
- A few of our venture companies grew more than 100% y/y
- We were also short several over-owned and high-profile stocks whose fundamentals had been deteriorating for some time, so that helped drive a lot of alpha
Our strategy of focusing on concentrated high-conviction shorts in conjunction with risk management (leveraging our data science to de-gross as our data slowed) provided us the breathing room to buy the best companies at discounted prices in December. That in turn helped to drive things in January.
It absolutely pays to buy companies like ServiceNow at near trough valuations when the company is growing 38% a year.
Taxes
We kept to our practice of investing with tax efficiency when it makes sense. We took some profits on long-term winners, tactically harvested losses, and utilized derivatives and synthetic instruments where appropriate to accomplish our long-term goals.
The recent changes to the US tax code will further provide a good opportunity for us to achieve gains through the ownership of esoteric assets and ever slightly more complicated structures that passive investors shy away from (prevents crowding). Our music investments in Qualified Opportunity Zones should allow partners to 1) defer capital gains taxes on funds used for their initial investment, 2) eliminate taxation on up to 15% of those gains, and most importantly 3) eliminate taxation on all appreciation of the invested capital.
Keeping it simple
Our model is very simple: own great businesses and esoteric assets with secular drivers that can grow irrespective of whatever the market is doing. Likewise, sell the businesses everyone else thinks are great but are really being displaced by technological change. By combining our fundamental domain expertise with our JSTARS data science that illuminates what is really going on versus what the market thinks might be going on, we gain the confidence to ignore the noise and act when others cannot. During what was the worst quarter for the market since The Great Recession of 2008 and the worst December since 1931 during The Great Depression, JSTARS was incredibly helpful.
There is a growing disconnect between the perceptions of other public equity market investors and the reality of what companies are experiencing in the actual real-world economy. Perceived safe haven stocks that are actually quite unstable fundamentally are finally starting to crack. Take the semiconductor group at large for example: everyone viewed the companies as secular growth, but the reality is cyclical decline tied to bloated inventory, plateauing end markets, and global trade wars. Conversely, as we look at our real estate assets: everyone views the companies as no growth and tied to rising interest rates. The reality is secular growth tied to the structural shift to Cloud, mobile communications, autonomous vehicles, and drone delivery propelling tax advantaged 20%+ annual returns. When it comes to real estate, we just have a different perspective than most and that differentiated point of view allows us to find a lot of value.
This disconnect between market perceptions and fundamental reality provides us the opportunity to sell at premium prices companies that are slowing and buy at a discount companies that are growing. That’s our playbook and, while its always easier said than done, JSTARS data helps us get there.
Data is king
It is incredibly clear to us that data is a secret sauce that can enable success in a business. All good companies have execution, sales motion, supply chain, etc. What is different and scarce is the data and the ability to utilize that data for action. That is a competitive advantage. This thesis has been a guiding force for our enterprise technology investments and given the power of data it is likely to sustain for cycles into the future. We have a lot more coming.
One of our biggest ideas continues to be next generation entertainment platforms and how data enables a superior product. Consumers get the content they want, whenever and wherever they want it. The business supplying this content can do so more successfully and more efficiently. Globally. The data is the key secret sauce.
Netflix's 140 million global paying subscribers represent only about 15% global penetration. We believe Netflix can approach 50% penetration (or more than 450 million subscribers) in the next five years based on historical adoption curves by territory. Netflix's growth is accelerating with more than 28 million paid subscribers joining the service in 2018. Said a different way, Netflix added an entire Comcast worth of subscribers in 2018 and is expected to add nearly two Comcasts in 2019 (Comcast is a $277 billion enterprise versus Netflix’s $155 billion). At this level of scale, we would expect near 50% operating margins on $80 billion of revenue, implying a roughly 30% annual return.
Core data empowering content examples from our portfolio include:

Software makes the world better, faster, stronger
As the global economy increasingly exhibits late cycle characteristics, we find a lot of value in owning innovative software companies. Apart from the superior business model (99% incremental margins, recurring revenue, high barriers to entry), the main reason is because software provides tremendous value to customers, making them better, faster, stronger, just when they need it most.
Customers that are flush with cash but are facing headwinds, be them cyclical deceleration or technology driven disintermediation, provide a great opportunity for software to help. Low cost of entry, immediate return on investment, increased efficiency, and greater agility are among the benefits customers enjoy in upgrading business processes and systems to next generation software. However, with their high growth rates, software companies often get swept up in temporary stocks market declines as growth and momentum factors get sold. It then becomes a matter of identifying the companies that add the most value to customers and whose stocks are trading at depressed or dislocated prices.
Core software examples from our portfolio include:
The execution from the team at Docker, the next generation Cloud computing platform, has been outstanding. It is hard to describe without being too granular, but we can frame it this way: Docker at this stage, based on pattern recognition and muscle memory, reminds us of its elder cousin VMware. Both companies offer tremendous financial and business value to customers and deliver immediate return on investment, making them easy products to buy. We were early in VMware at our prior fund and eventually became the third largest shareholder. Docker is VMware 2.0. Companies need to modernize, to become better, faster, strong. Docker helps with that.
Building the next generation machine-to-machine communication network
Everything from streaming a Netflix series while waiting at the airport to robotic farmers tilling the fields to autonomous semi-trucks driving across the country to intelligent appliances re-ordering milk to drones delivering medicine to hard to reach places . . . all of these use cases depend on an underlying communications network. We can create tremendous value by building a next generation network platform that can support and enable innovations we haven’t even thought of yet.
The principle problem is that our existing networks were designed more than forty years ago! If your cell phone has ever dropped a call, you have experienced firsthand these networks breaking down under loads they were never designed to support. Based on Cisco’s latest network analysis, mobile data traffic in the US is expected to grow 5X from 2019 to 2022. To put that in perspective, this means that mobile traffic will be 12X the volume of all US internet traffic in 2005. The sheer scale of this demand is staggering.
To meet the specifications required by users and applications, a more than 10X increase in network performance as measured by latency, reliability, and speed will need to be achieved. That ten-fold increase in value demanded is likely to drive a commensurate increase in value for our investments.
We have chosen real estate assets as our way to invest in this machine-to-machine communication network for three big reasons: 1) security (these are hard assets), 2) scarcity value (location, location, location; you simply cannot recreate or replicate these assets), and 3) platform economics (as the platform underpinning everything else above it, very health economics are likely to trickle down to us). If you think about the $130 billion of revenue at Google and the $120 billion of revenue at Microsoft, you are looking at platform economics. Now just wrap that up into a secure, tax advantaged, high dividend yielding real estate wrapper.
We own a piece of more than 40,000 telecommunications towers located in each of the top US markets, more than 65,000 route miles of dense, high capacity fiber optic cable, more than 50 critical highly connected datacenters, and more than $20 billion of high-quality wireless spectrum. Through ownership of these assets, we are very well positioned to capitalize on the incredible growth in data.
What is extremely exciting is that our portfolio combines core assets that are producing terrific returns today, an emerging business that is inflecting as we speak, and a scarce resource that will provide platform returns for decades to come. Over the past eight years, the core business has driven a compound annual return of more than 26%. The emerging business in small cells is leasing up at double the rate of the tower business at this point in their respective lifecycles and the initial yield is higher than the core business. Our spectrum asset can never be reproduced, can never be replicated, and touches nearly every innovation we can think of as technologists.
Our telecommunications tower business generated rental revenue growth of 29% last year and is seeing a meaningful acceleration in leasing looking into the backlog for 2019. Through disciplined capital allocation and execution, our operating team is translating revenue into long-term growth in dividends of more than 8% per year.
Our emerging fiber business enables technologies that you may have heard of including small-cells, 5G, fixed wireless, and distributed antenna systems. The team was first to market and has taken a leadership role in building the industry. While the business is still young, the investments here are already producing a greater than 8% yield with returns exceeding those of the core business at this stage of the asset’s development. Looking into the 2019 backlog, there is an acceleration in demand and the team is planning on doubling production to try to keep pace. It takes 18 to 24 months for contracted orders to be implemented, so we have very good visibility in revenue growth well beyond 2019.
The communications infrastructure assets we own resemble a very low-tech way to play a very high-tech future. As the underlying platform that underpins future innovation, we are in the best position to capture returns in the largest and fastest growing data market in the world. We are seeing increasing demand as the need for advanced communication assets accelerates. With scarce esoteric assets powering disruptive innovation, we have a great asymmetric opportunity to create value.
Next generation communications assets from our portfolio include:

Worried about yield curve inversion?
Then we should own a portfolio of esoteric assets.
Investors that are students of history will highlight the specter of an inversion in the yield curve, a dynamic in the credit market where the interest rates demanded by investors for long-term loans are lower than the rates demanded for short-term loans. A 10-year loan costing less as a 2-year loan makes no sense, in most situations.
Historically, an inversion has preceded recessions. The problem with this as a predictor is timing. If we look back at the last economic cycle, the inversion occurred in late 2005 and equities peaked a full 22 months later in 2007. Selling in 2005 had the potential of missing or being on the wrong side of a very powerful bull market. If we look back through 1964, the average S&P 500 return following the inversion has been +24.5%. The cost of selling good companies early can be significant.
One way we have sought to underwrite this risk is by leveraging JSTARS to ingests millions of disparate fundamental data points to provide a comprehensive view of the economy. Our economic dashboard lets us focus on our technology-driven assets while keeping an eye open to the world around us. While it points to pockets of slowing in some areas (cyclical buckets), it also points to acceleration in others (secular growth assets). The pockets of slowing dynamic induces market gyration as investors rebalance and try to catch up with the fundamental trends—usually meaning people shoot everything first and ask questions later. This is where we can be discerning and take advantage of when others are not.
Take Verisign (VRSN) for example. Most investors have never heard of the company and the majority of prominent technology funds do not own the stock. Only two bank analysts cover the stock. For those unfamiliar, Verisign basically runs the internet. Globally. This is a de jure monopoly business with perpetual market position that is written into law, 4% unit growth + 5% price growth + earnings leverage + return to shareholders. The stock fell 19.97% in the recent market selloff. Yet, the Company will grow by about 15% each year and return 100% of free cash flow to investors. So, in theory the stock could go to $0.01 on paper, we could acquire the entire company, and our capital would grow by about 15% every year. Not too bad.
Contrast that with AMC Networks (AMCX). The company is the famous producer of the hit show The Walking Dead. The stock is owned by several very prominent investors that run some of the largest investment funds in the world. More than 20 analysts cover the stock. AMC Networks shares declined about 15% during the market selloff, just outpacing the broader market but faring better than VRSN. Yet, if we look fundamentally, the company’s main product is down 50% year/year—down fifty percent. EBITDA grew only 2% last year, is set to decline 3% this year, and is forecasted to decline 37% next year. Cash is king. Free cash flow declined 30% last year. Without any hard assets, the company may very well go bankrupt at some point in the future.
Here we have two stocks, VRSN and AMCX, both down along with the market. We have two companies, Verisign and AMC Networks, one a monopoly tied to secular growth themes and the other seeing its business decline 50% a year. Investors shoot first and ask questions later. On paper both stocks could go to zero in the interim, and that is always dicey to think about especially in the midst of a market selloff. Ultimately, one company is going to grow irrespective of the market. Over the next ten years, we will take VRSN versus AMCX any day.
Our conclusion is esoteric, under-the-radar, uncorrelated assets fueled by secular growth provide the best opportunity for economic growth without having to worry about the stock market. If it is a monopoly business with a structural moat (especially if de jure), even better.
A few other macro things to consider:
- The stock market stalled in 2018 in part due to the perceived lack of incremental stimulus. Quantitative easing (QE) is being withdrawn globally. The prevailing thought is how do you top the tax cut of 2017? 1Q19-2Q19 is set see an incremental $70 billion in federal income tax refunds due to the 2017 tax cuts, net of the State and Local Tax (SALT). If these funds are spent during the first half of 2019, that lifts nominal GDP by 2% annualized. A similar dynamic occurred in 2012. The S&P 500 rose 15.8% in 2012 and 32.2% in 2013.The stock market is a discounting mechanism, meaning it generally trends to be more concerned what about happens next versus what is going on today. Mathematically, this quarter is likely to be the low point in growth for the year. Sequential acceleration in economic growth is likely a construct that investors broadly want to buy.
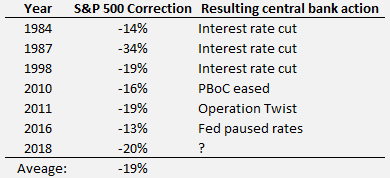
- Our JSTARS data tells us the US economy is humming along, despite the correction in the stock market. In that context, there have been six sizable equity market corrections without an ensuing economic recession since 1984. The average market correction was -19%. The S&P 500 recently exceeded that level of decline in 4Q18. Each of the six previous corrections resulted in some sort of central bank help:

Our view is that the January 30th Federal Open Market Committee (FOMC) meeting made clear that the Federal Reserve is in a more accommodative stance than they were in 2018. That should help.While we cannot be certain what the current regime will do next in response to equity market declines, we can observe that following each of these prior six corrections, real GDP growth was sufficiently conducive to growth. The slowest real GDP growth in the quarter immediately following the correction was +2.1% in 1987 and the average growth was +3.8%. The slowest second quarter following the correction was +1.9% in 2016 and the average growth was +3.3%.If we look back to what the S&P 500 tends to do with even moderate levels of GDP expansion, 2011, 2012, and 2016 saw rolling four quarter real GDP growth of about 1.7% (+1.5% to +1.9% range). With roughly half of the average GDP growth following the aforementioned market corrections, S&P earnings grew an average of +5.8% during those years (+5.1% to +6.8% range) and the S&P 500 Index grew an average of 7.6% (-0.20% to +13.5% range). Basically, below average GDP growth was conducive enough to support about average S&P earnings growth and an average stock market performance.
A general macroeconomic backdrop of +2%-4% real GDP growth is solid agar to foster the greater than 20% secular growth of our portfolio companies and a good medium for investors to discriminate between secular growth stocks and those of companies unable to match even moderate GDP growth rates.
- The China-US trade war has caused disruption in the industrial economy—we see this clearly in JSTARS. For the first time since 2016, Chinese manufacturing PMI recently fell below 50, marking contraction. However, non-manufacturing PMI has risen sequentially, providing evidence that President Xi’s stimulus initiatives are making a positive impact. By ingesting a multitude of primary data points on trade health, we will closely monitor the trade situation as official negotiations progress in 2019. The dichotomy between industrial contraction and non-industrial expansion underscores our thesis to buy assets exposed to secular growth trends and to be very weary of assets driven solely by cyclical forces or financial engineering.
Sincerely,
Kris
This article first appeared on ValueWalk Premium


