DoubleLine Rising Rate Funds Webcast with Portfolio Managers Philip Barach and Robert Cohen for the month of February 2019, looking at the historical yield curve comparison.
TAB I – Market Overview
U.S. Interest Rates
Source: Bloomberg
You cannot invest directly in an index.

Q4 hedge fund letters, conference, scoops etc
U.S. Yield Curve: 2017 vs. 2018
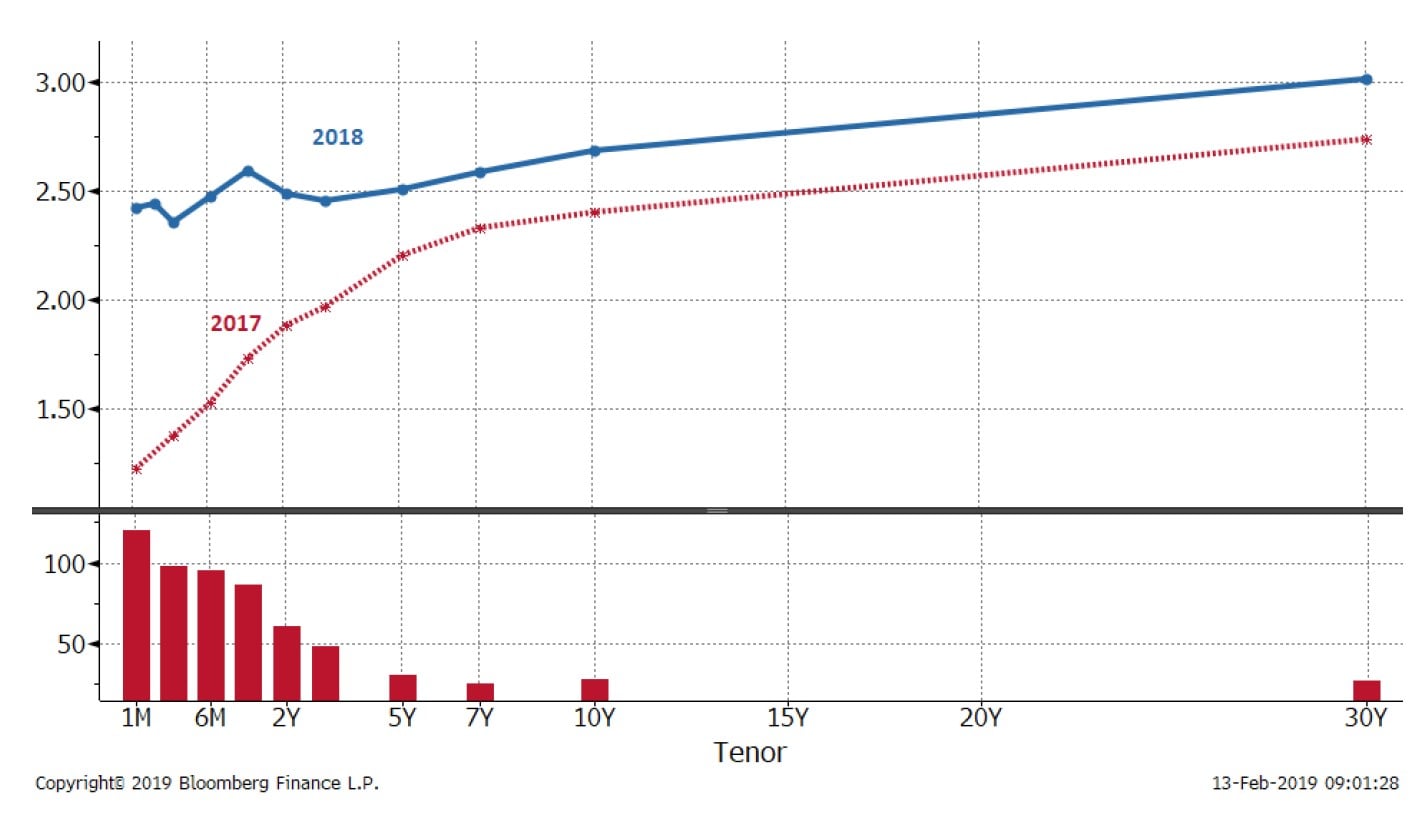
Source: DoubleLine, Goldman Sachs
The chart is a historical yield curve comparison between 12/31/2017 and 12/31/2018.
S&P/LSTA Leveraged Loan Index is designed to reflect the performance of the largest facilities in the leveraged loan market. A-BBB are credit ratings by Standard & Poor’s.
U.S. Yield Curve: 2017 vs. 10 months into 2018
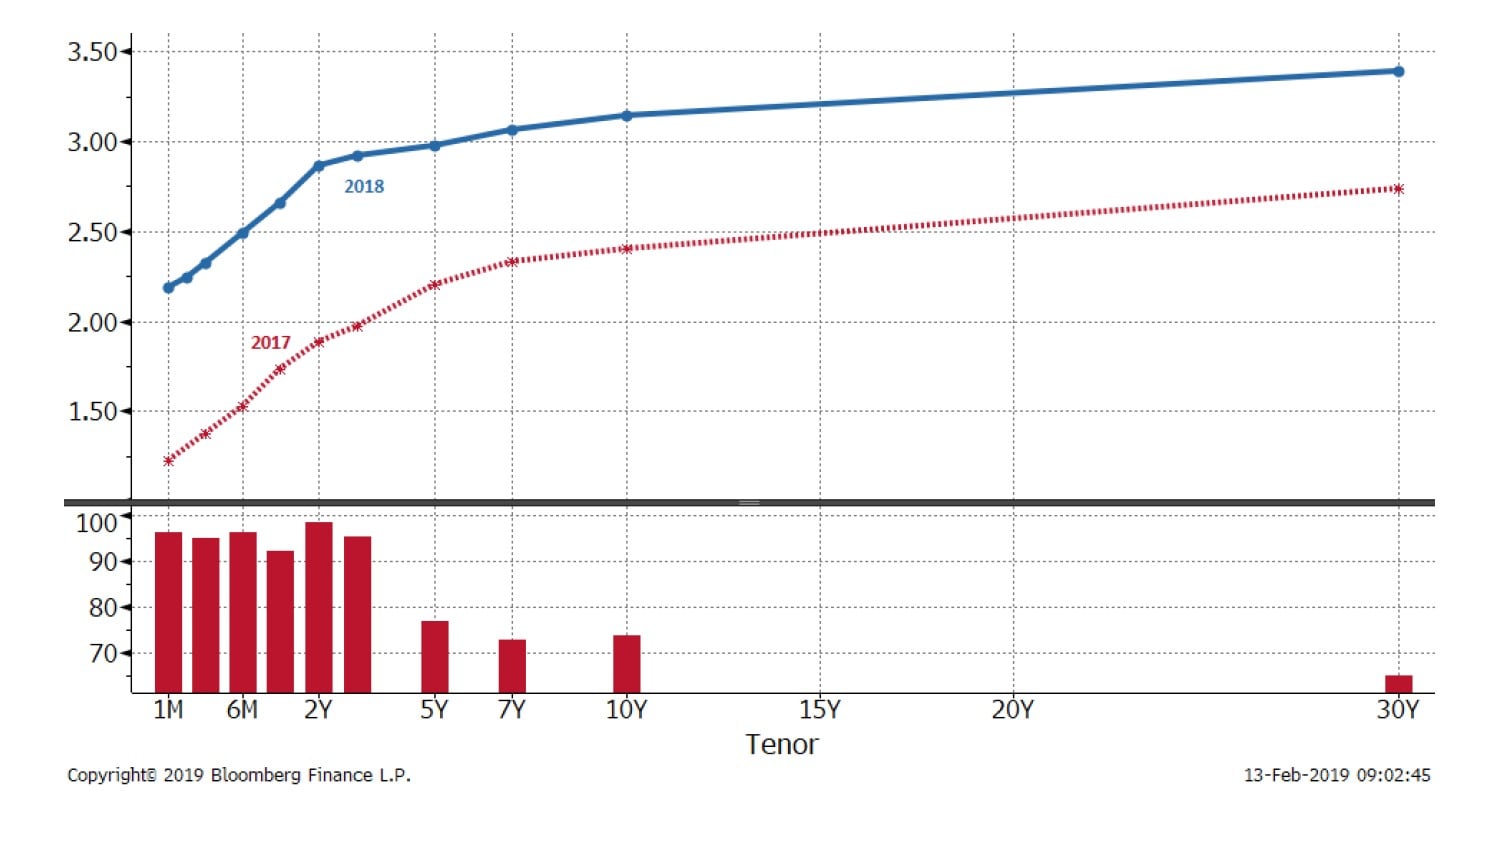
Source: DoubleLine, Goldman Sachs
The chart is a historical yield curve comparison between 12/31/2017 and 12/31/2018.
S&P/LSTA Leveraged Loan Index is designed to reflect the performance of the largest facilities in the leveraged loan market. A-BBB are credit ratings by Standard & Poor’s.
U.S. Yield Curve: Last 2 months of 2018 vs. 2018
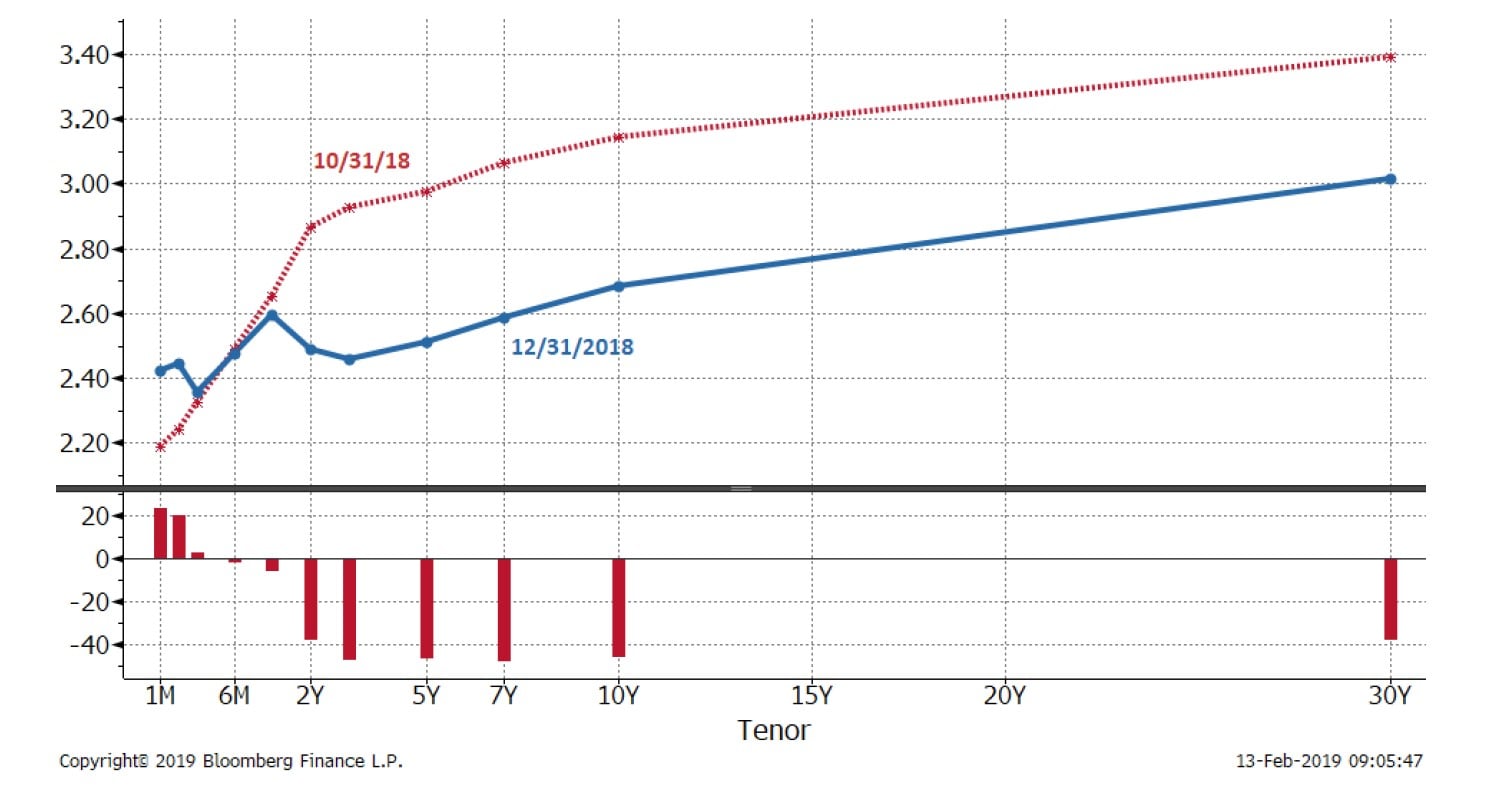
Source: DoubleLine, Goldman Sachs
The chart is a historical yield curve comparison between 12/31/2017 and 12/31/2018.
S&P/LSTA Leveraged Loan Index is designed to reflect the performance of the largest facilities in the leveraged loan market. A-BBB are credit ratings by Standard & Poor’s.
Fed Dots vs. Market Expectations 2018, 2019, & 2020
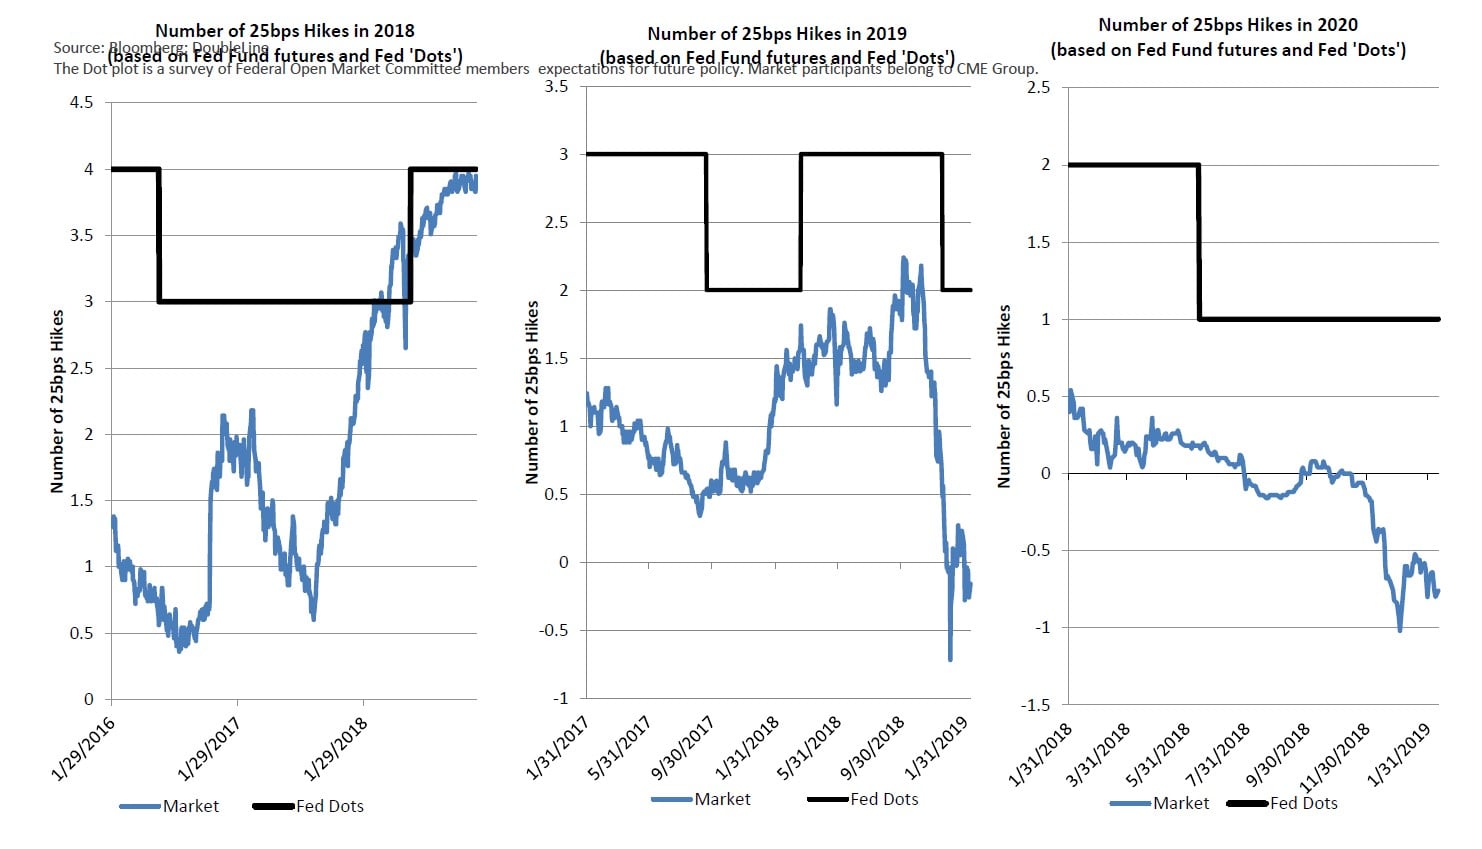
U.S. Rate Hike/Cut Odds (Bloomberg WIRP)
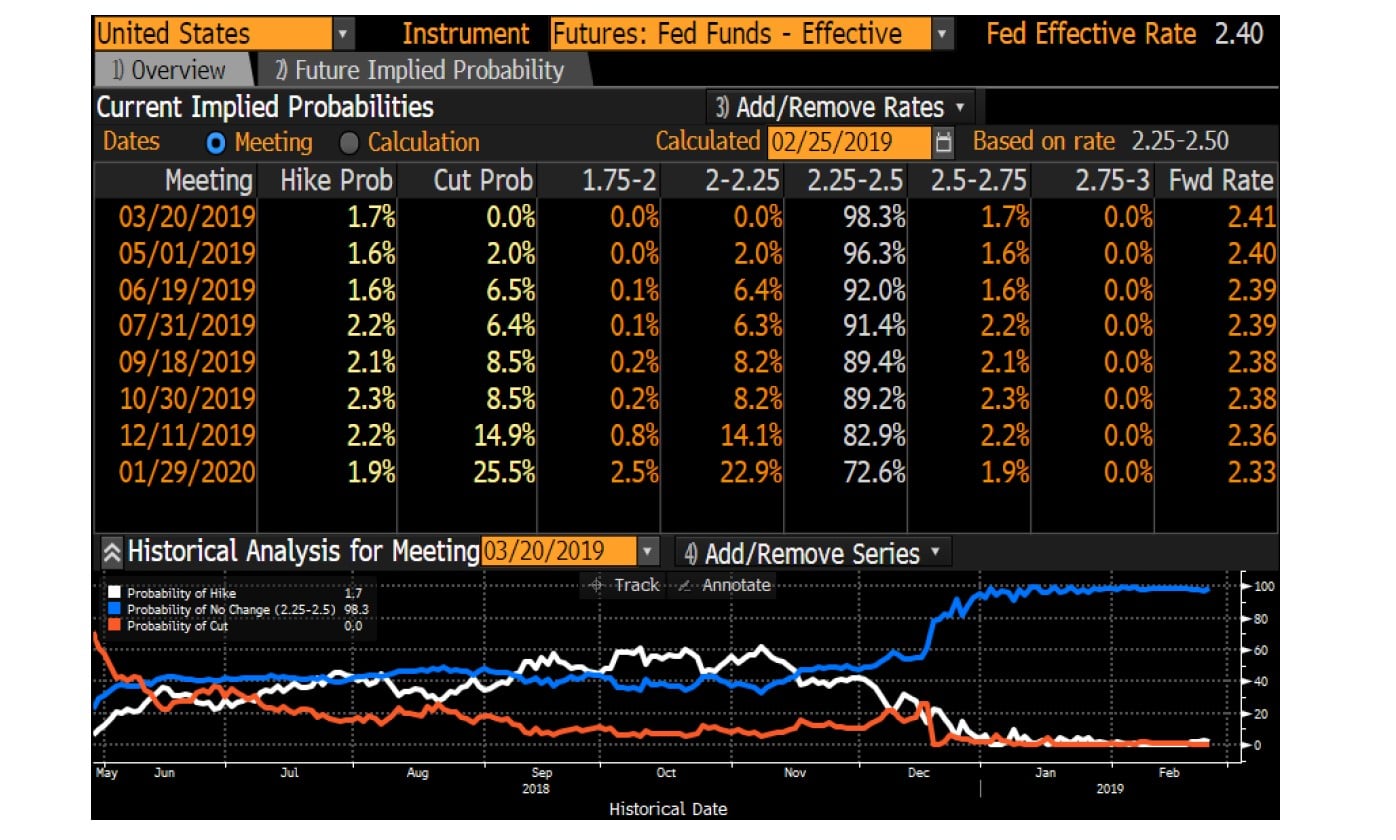
Source: Bloomberg, DoubleLine
Global Real GDP Growth YoY

Source: Bloomberg, DoubleLine
Please see appendix for index definitions. You cannot invest directly in an index.
2s10s and Recessions
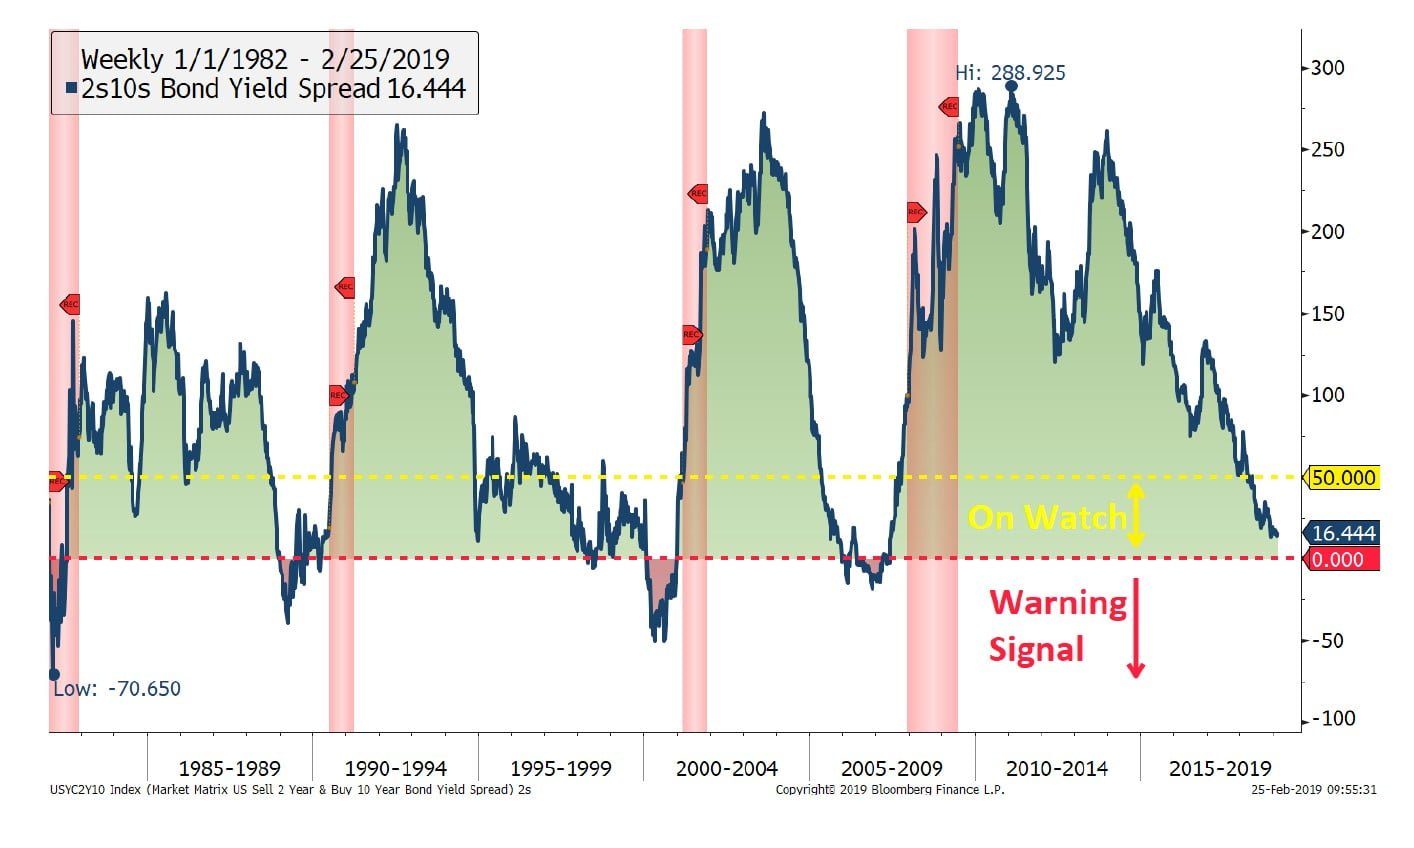
Source: Bloomberg, DoubleLine
U.S. Conference Board Leading Economic Indicator
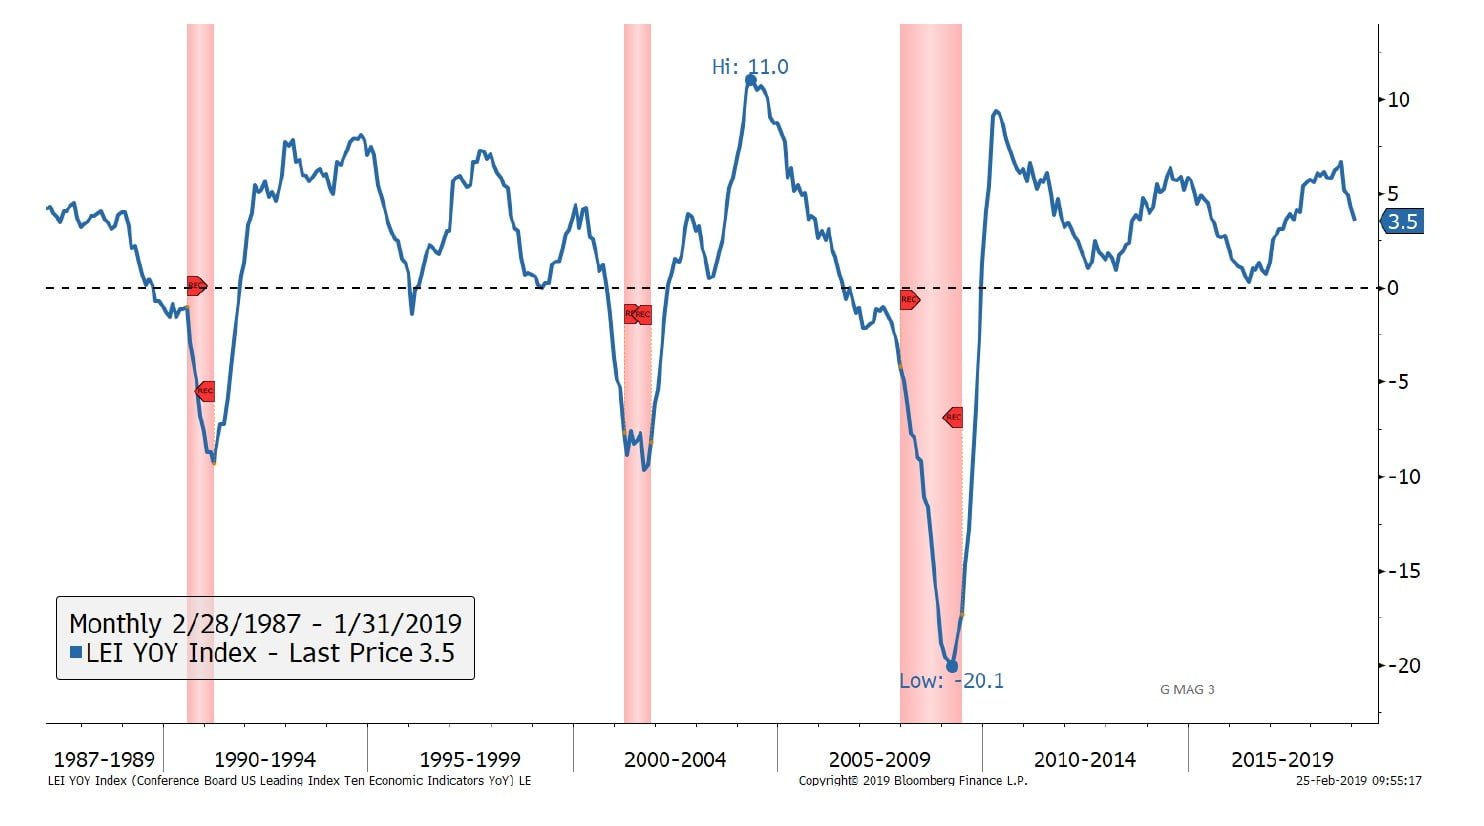
Source: Bloomberg, DoubleLine
Conference Board U.S. Leading Index = indicators include economic variables that tend to move before change in the overall economy. These indicators give a sense of the future state an YoY = year-over-year. You cannot invest directly in an index.
U.S. Industrial Production
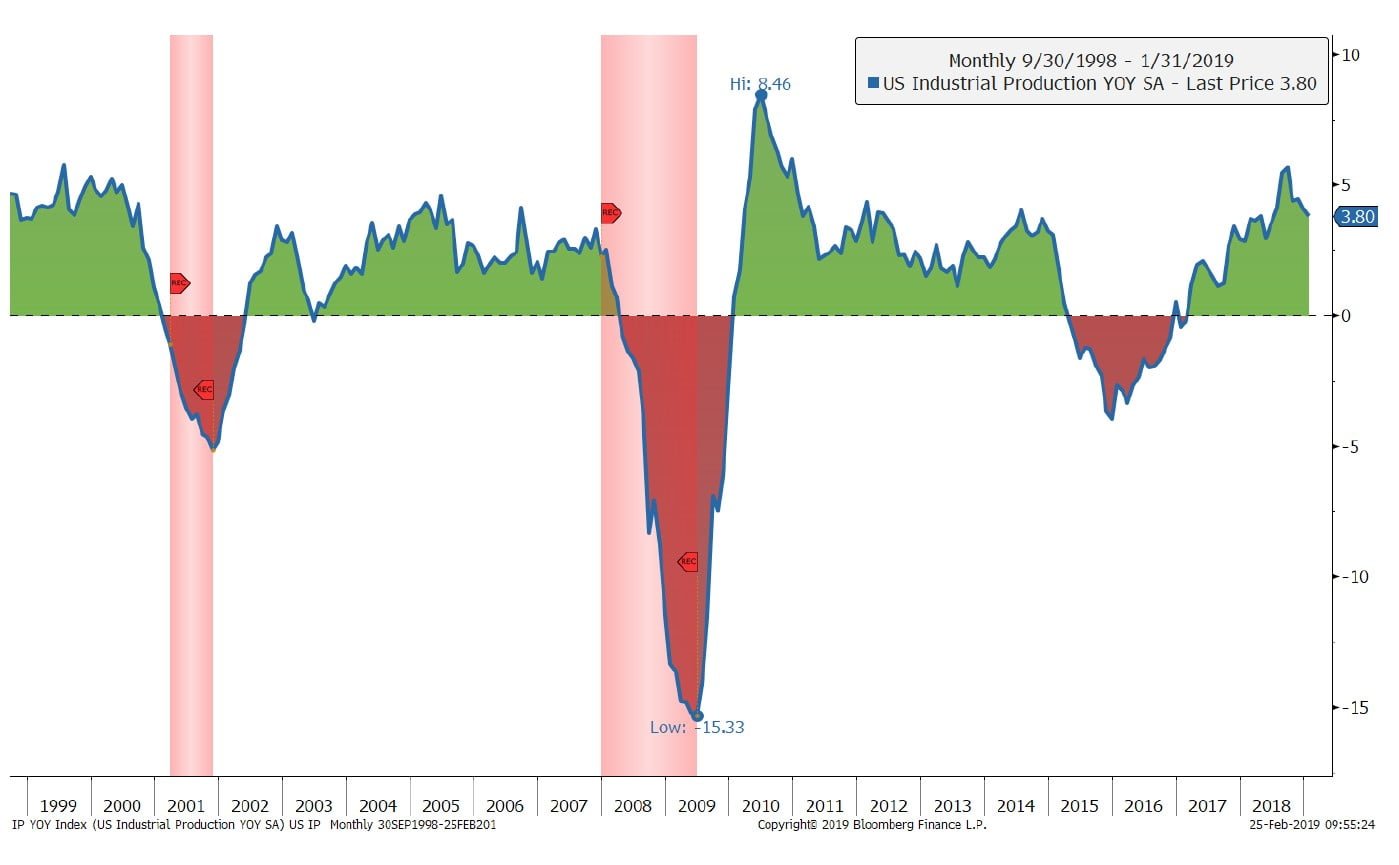
Source: Bloomberg, DoubleLine
Red shaded areas indicate recessionary periods.
U.S. Manufacturing and Services PMI
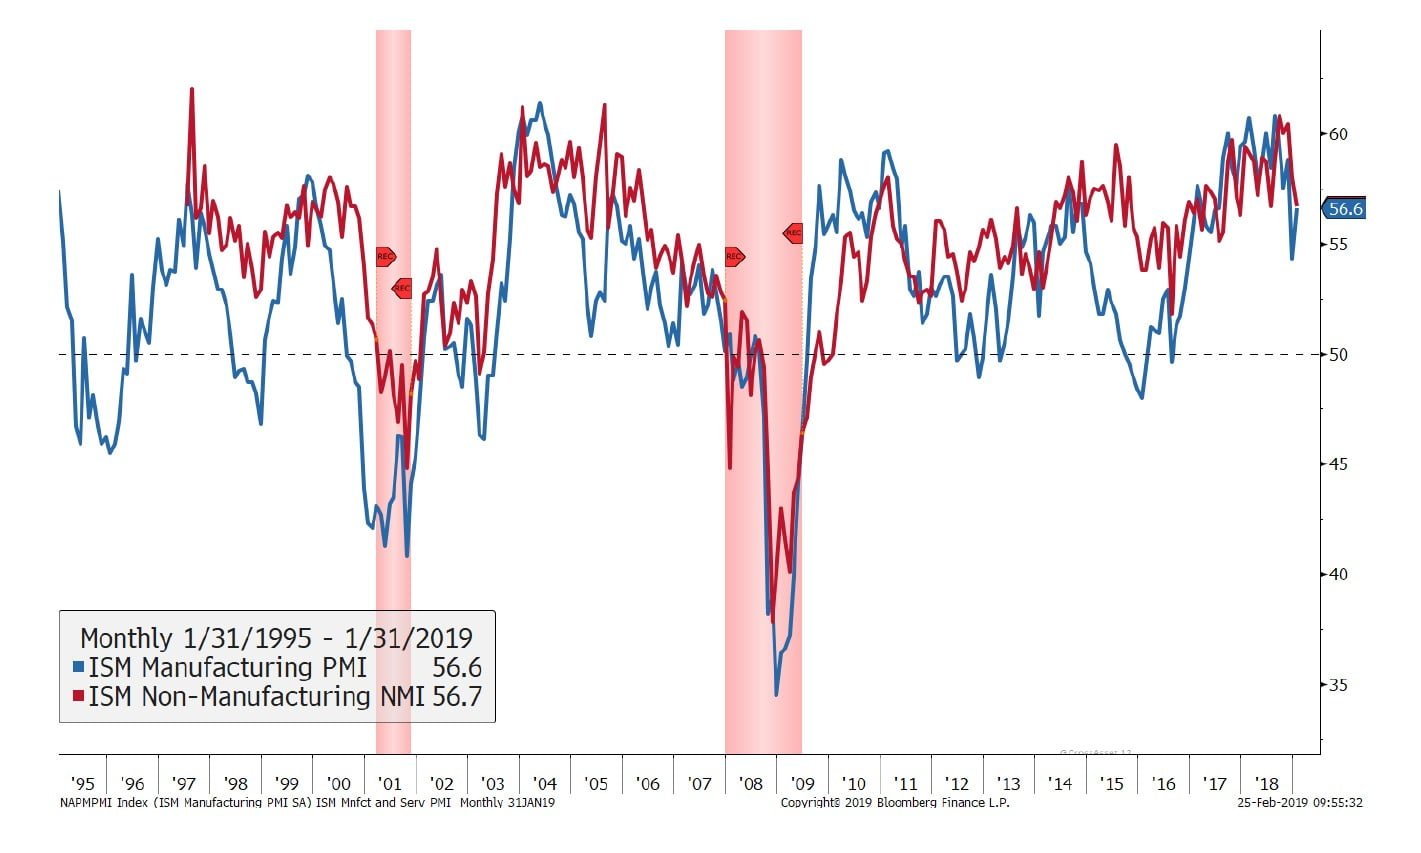
Source: Bloomberg, DoubleLine, ISM
ISM Manufacturing Index is based on surveys of more than 300 manufacturing firms by the Institute of Supply & Management. PMI = Purchasing Managers’ Index is an indicator of the economic health of the manufacturing sector based on five major indicators: new orders, inventory levels, production, supplier deliveries and the employment environment. You cannot invest directly in an index.
See the full slide below.


