Pure Value Capital commentary for the fourth quarter ended December 31, 2018, discussing the a) real long term returns of stocks and bonds, b) volatile stock prices, stable intrinsic values, c) causes of permanent or long term capital losses.
Facts
In Q4 2018 the Net Asset Value of the Pure Value Capital fund declined by 4.75% from 117.03 to 111.47. Over the entire year 2018 the NAV declined by 5.80%. The return over the October 2016 – December 2018 period amounts to +11.47%. At the end of 2018’s Q4 the solvency ratio and the net debt to equity ratio of our portfolio amount to 58% and 11% respectively. The portfolio’s dividend yield tops 3.7%. At the beginning of Q1 2019 the average valuation of the 22 tracked equity markets comes below the historical median at the 42nd percentile. Over the 4th quarter 2018 the price-to-book ratio of the model portfolio dropped to 0.57, a decline of 19% compared to the starting valuation at the beginning of October 2016. For the outline of the geographical and sectorial spread at the end of 2018’s Q4 we refer to the matching Fact Sheet. At the beginning of Q4 2018 we increased our positions in some European and Asian companies and sold some positions in Brazil. For the first time since October 2016 we initiated equity positions in the US stock market.

Q3 hedge fund letters, conference, scoops etc
"Anxiety At -4%"
Over the previous quarter, a quarter characterised by significant downward price fluctuations for almost all equity markets (Brazil stock market is one of the few exceptions), various financial advisors informed us that it is not obvious to rationalize an annual return of minus 4% on a managed portfolio and/or to explain to a client. Anyhow a negative annual return within the long term component of your wealth does not need to give rise to concern.
Taking away this anxiety requires at least three insights: a) insight in the long term returns and the corresponding risks of the various asset classes, b) the insight that stock returns are much more volatile compared to the underlying corporate fundamentals (meaning: investors tend to overreact) and c) insight in the causes of permanent or long term capital losses.
A) Real Long Term Returns Of Stocks And Bonds
“One thing badly needed by investors is a sense of financial history.
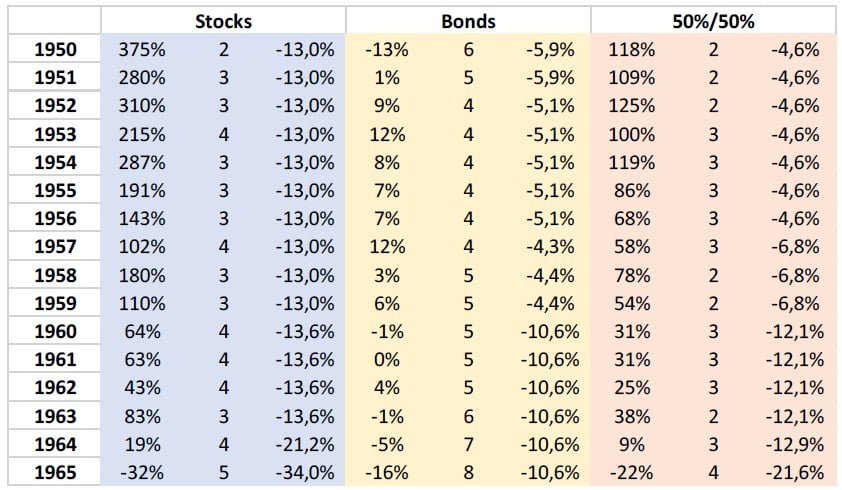
In the absence of any historical insight it is very difficult to frame actual returns in a rational way, hence in this section at first we take a look at the real (i.e. taking into account increases in the consumer price index) returns of stocks and long term government bonds over the 1950-2008 period for the US, each time examining ten year periods. We consider ten years an appropriate investment horizon for a long term investor. The ten year real returns are shown in the table below. The table also documents the ten year real returns of a 50% equity / 50% bonds portfolio with annual rebalancing. An example of how to read the results in the table: an investor who at the beginning of 1950 invested an amount in stocks realised over the 1950-1959 period a real total return of +375% (1ste blue column). Over this ten year period equities realised in 2 (2nd blue column) out of the 10 years a negative real return with a minimum of -13.0% in a specific year (3rd blue column).
The figures in the previous table initially show that each ten year period for the three portfolios was characterized by at least one year with a loss in real terms of at least -4.3%. As a consequence there wasn’t a single ten year period during which investors realised a positive real return during ten consecutive years. Periodic negative real returns on an annual basis are inherently linked to the three portfolios over a ten year investment horizon.
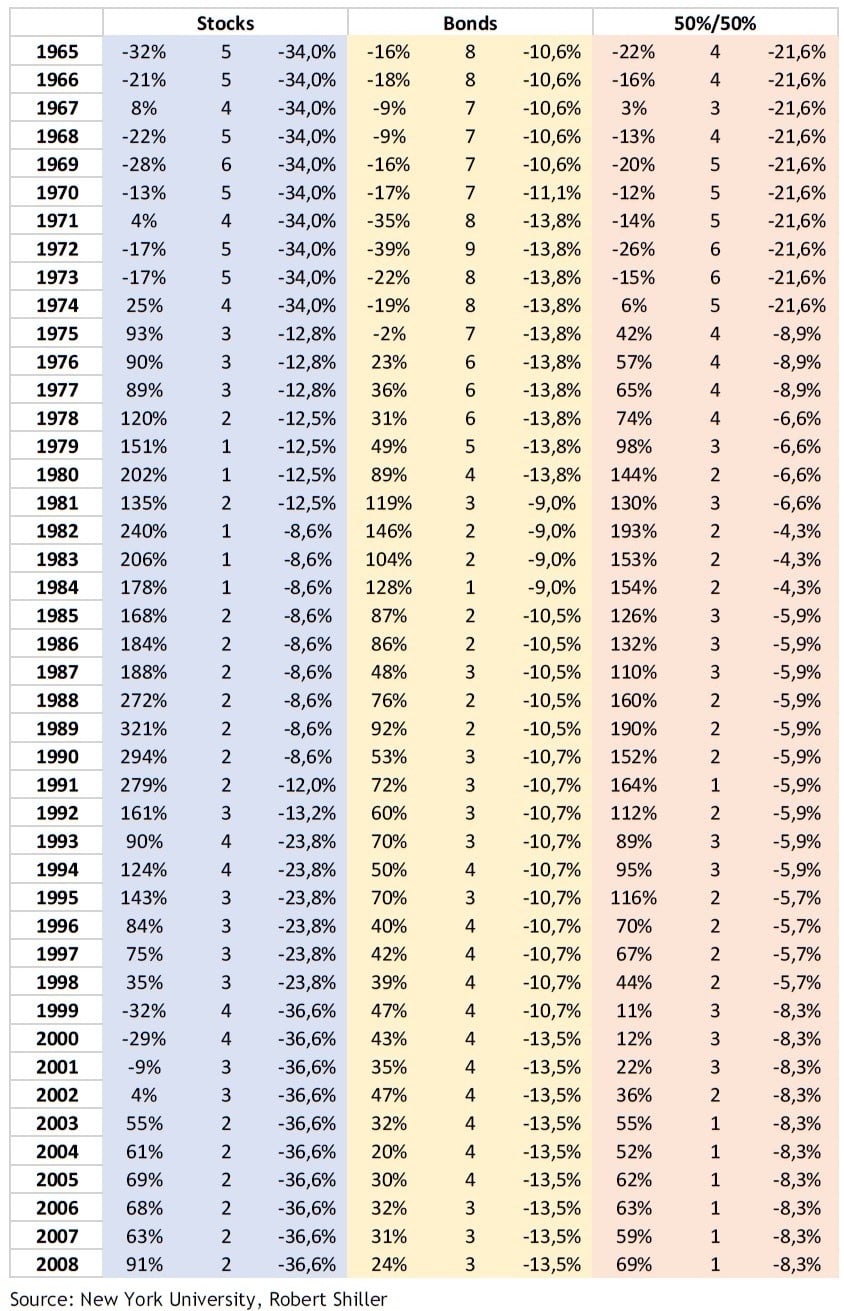
If we subsequently use the ten year periods percentage with a negative real return as risk measure, we find that bonds are less safe compared to equities or the balanced portfolio. After all the previous table shows us that in 10 out of the 59 ten year periods, investors in equities are confronted with a real capital loss after ten years. The most negative real return, -32%, was – hardly surprising - realised over the 1999-2008 period. For long term government bonds we document 16 periods with a negative real total return and a real total return of -39% over the 1972-1981 period. The balanced portfolio showed a negative real return in 8 out of the 59 ten year periods with a minimum of -26% over the 1972-1981 period.
Also if we take a short term perspective and look at the average number of years with a negative real return over a ten year period we find that government bonds are more risky. On average equities were confronted with 3 real loss years over a ten years period. The investor who at the end of the 1960s invested his capital in equities experienced 6 years with negative real returns. Bond investors fared worse and experienced on average 4.6 real loss years over an investment horizon of ten years. The investor who invested his wealth in bonds at the beginning of 1972 was confronted with 9 (!) years with negative real returns. For the balanced investor we note 2.8 loss years – slightly lower than for equities – with a maximum of 6 loss years.
Eventually when looking at the upward potential we document for equities an average ten year total real return of +112%. Bonds come with +31%, the balanced portfolio scores on average +61%.
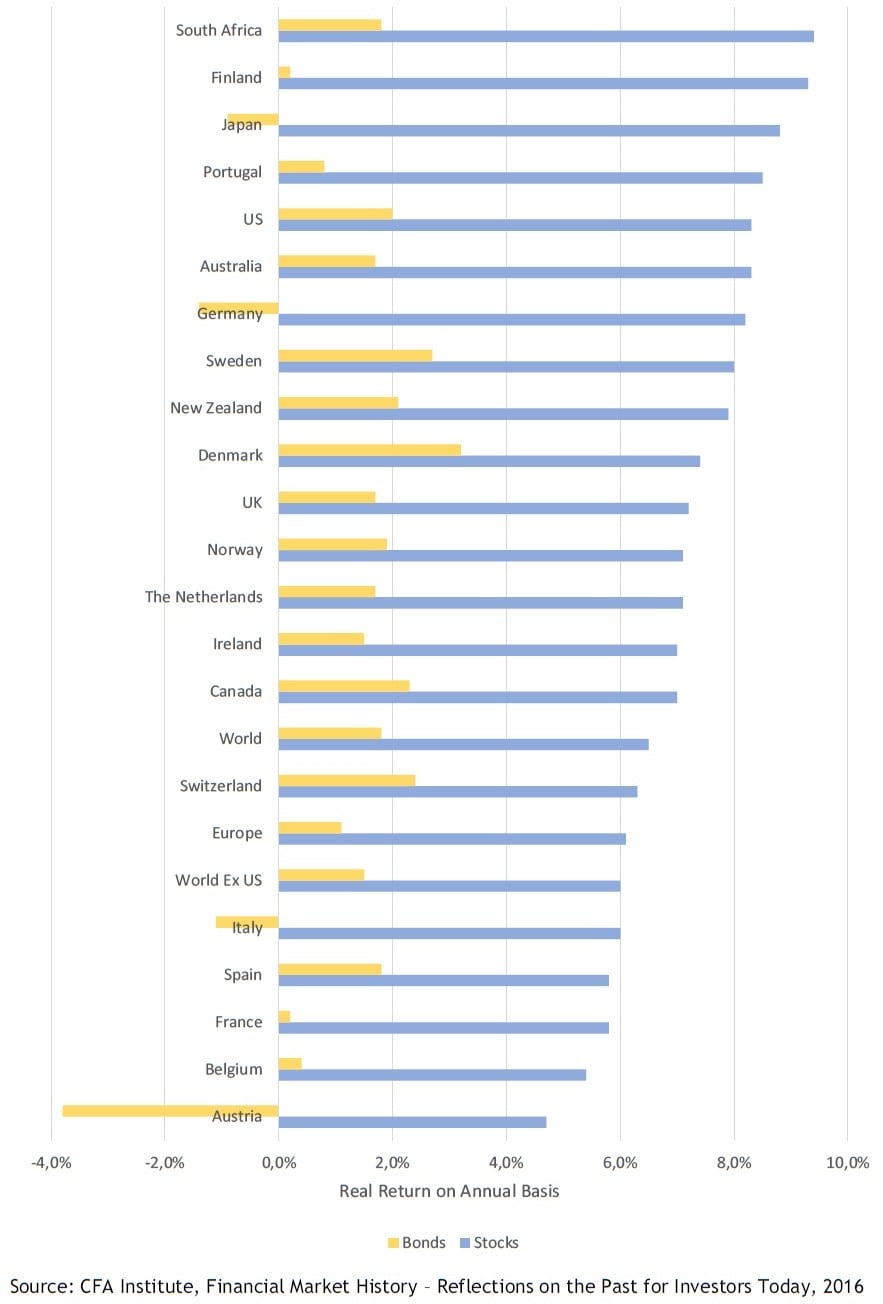
Quantitatively similar results have been documented for other countries. In Financial Market History – Reflections on the Past for Investors Today (2016) the real returns for stocks and long term government bonds are presented in 22 countries over the 1900-2015 period. The graph on the next page shows the compound real return per year for stocks and bonds. In each country stocks realise a higher real return compared to bonds. Equities realise a real return of 3% to 6% per year. The real return was negative in not one single country. The real return of bonds across the 22 countries is 1% per year. In 4 out of the 22 countries bond investors were confronted with a negative real return. In countries such as Russia and China, where private property rights were abolished and all assets were confiscated by the government, holders of financial assets lost their entire capital. In Germany and Austria savers and bondholders saw the purchasing power of their wealth was vanished due to hyperinflation (monetary confiscation). By the way, in relation to Germany we refer to our quarterly report of September 30, 2017. In that report we argued that – due to zero interest rates and massive “quantitative easing” – Germany was caught up in an ideological and economic bubble. Over the previous year the German stock market has been one of the worst performing stock markets in the world.
Based on the previous discussion at least two important lessons can be advanced for investors. The historical figures show that in the short run years with negative real returns are inherently part of a traditional investment strategy composed of equities and/or bonds. Secondly equities compared to bonds show a more attractive risk-return profile for the long-term investor.
B) Volatile Stock Prices, Stable Intrinsic Values
“The behavior of stock prices departs radically from this concept of intrinsic worth. On the whole, prices respond vigorously to any significant change in either current earnings or short-term earnings prospects.
In the previous months the financial websites’ front pages published news articles with misleading titles such as these:
“Stocks are signalling recession scare but that doesn't mean there will be one” - CNBC, December 28, 2018
However every investor knows that an economic cycle consists of both upward and downward stages. During recessions corporate profits are relatively low; in times of boom corporate profits peak. The intrinsic value of a company is determined by the on average expected profit over an economic cycle – taking into account both good times and bad times – and an average valuation. In practice we find however that in times of boom (recessions) stocks are priced at peak (bottom) corporate profits and at high (low) valuations with large fluctuations in stock prices over the business cycle. In other words investors overreact and periodically drive prices far above or far below their intrinsic value.
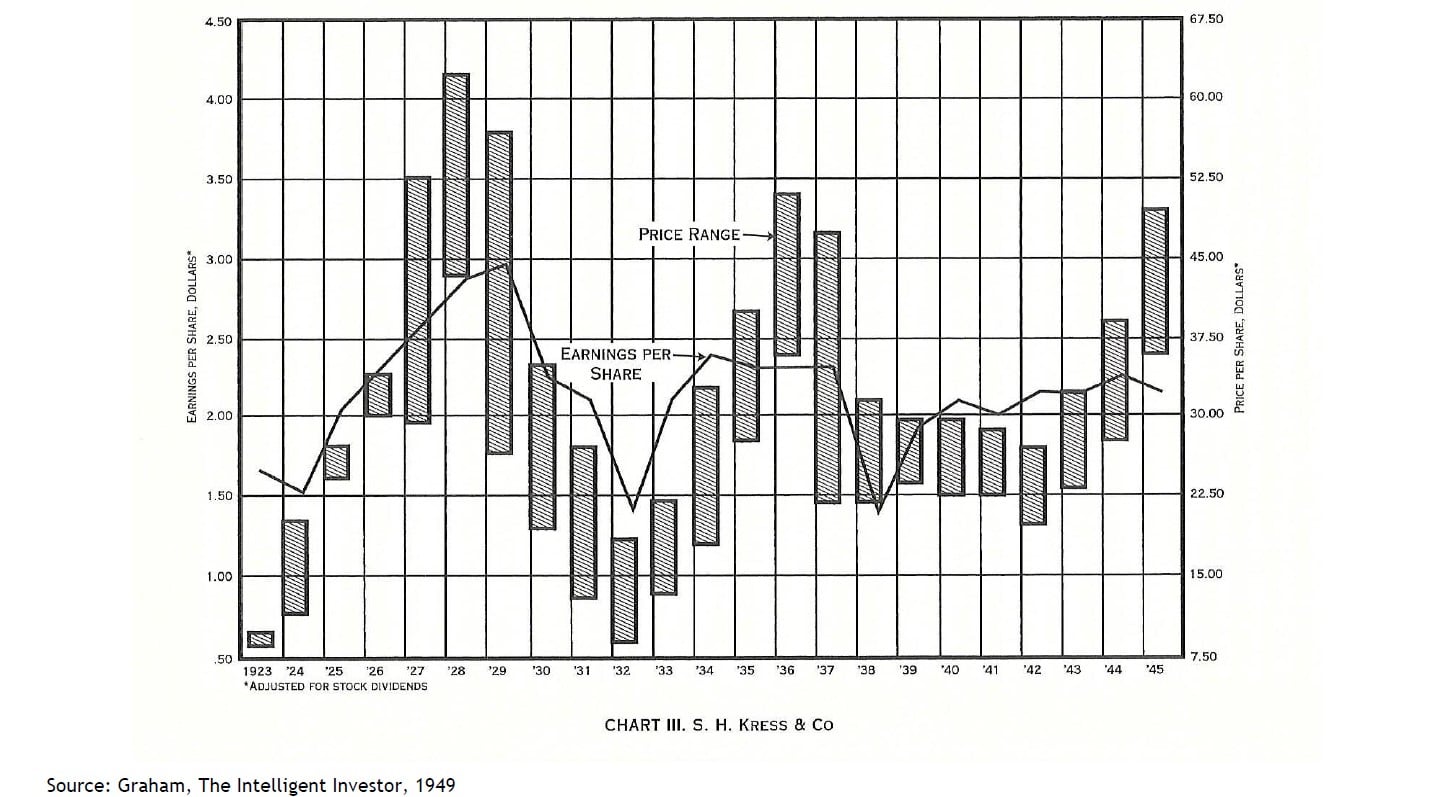
This is illustrated on page 9 in a graph of Graham (1949). The graph shows the evolution in the earnings per share of the retail company S.H. Kress & Co on the left y-axis and the price fluctuations on the right y-axis over the period 1923-1945, including the Great Depression of 1929-1933. In 16 out of the 22 documented years earnings per share of the company fluctuated within the very narrow range of $1.93 - $2.22. Despite these very stable fundamentals, the stock price of S.H. Kress & Co fluctuated widely over the range $7 - $62.
In 1980/1981 Shiller showed that stock prices are indeed significantly more volatile than their underlying fundamentals, the dividend streams. In regard to the Great Depression Shiller notes (1981, 1988) that the crash in the stock market over the 1929-1932 period involved a very limited decline in the intrinsic value of the companies in the Standard and Poor’s index. Despite the scope of the Depression the decline in corporate profits and dividends was too tiny and too short in order to have a significant impact on intrinsic values. Like Graham, Shiller ascribes the excessive stock price fluctuations to psychological factors.
An intelligent investor consequently realises that stock prices are much more volatile than the underlying corporate fundamentals (see also the next section), he will abstract from the emotion-driven excessive fluctuations and focus on the impact of these fluctuations on equity valuations. Time and time again the key lesson that investors should never forget is stated at the top of our Fact Sheet: He, the investor, must deal in values, not in price movements.
At the beginning of Q1 2019 we sold for example our position in the substantially risen Brazilian textile and retail clothing company Cia Hering. At current stock prices Cia Hering’s valuation had risen above the 50th percentile. At the same time we bought equity positions in European, Asian and US companies with valuations below the 5th percentile. He, the investor, must deal in values, not in price movements.
C) Causes Of Permanent Or Long term Capital Losses
“Observation over many years has taught us that the chief losses to investors come from the purchase of low-quality securities at times of favorable business conditions. … It is then, also, that common stocks of obscure companies can be floated at prices far above the tangible investment.
Obviously for investors who are being confronted with negative nominal annual returns the question presents whether these losses will eventually result in a permanent or long term capital loss. The uncertainty that comes with answering this question forms the basis of their anxiety. In Security Analysis (1934) and The Intelligent Investor (1949) Graham identifies the two most important causes of permanent or long term capital losses: a) investors buy equities too expensive (stocks with high valuation risk) and/or b) investors buy equities with very weak fundamentals (stocks with high credit risk).
“Many common stocks do involve risks of such deterioration. But it is our thesis that a properly executed group investment in common stocks does not carry any substantial risk of this sort and that therefore it should not be termed risky merely because of the element of price fluctuation.
Graham (1949) argues that a well-diversified stock portfolio composed of companies with low credit risk will not be affected by the risk of a significant deterioration in the business economic fundamentals of these companies. In a recent study Asness et al. (2018) show that indeed there is a significant persistence in corporate fundamentals (solvency, profitability, liquidity,…) over the years. Firms with strong (weak) fundamentals retain these strong (weak) fundamentals on average over the next 5 to 10 years. So in combination with the low valuation risk the low credit risk ensures that the long term investor can rely on the intrinsic value of his wealth, notably during periods of economic and/or financial stress.
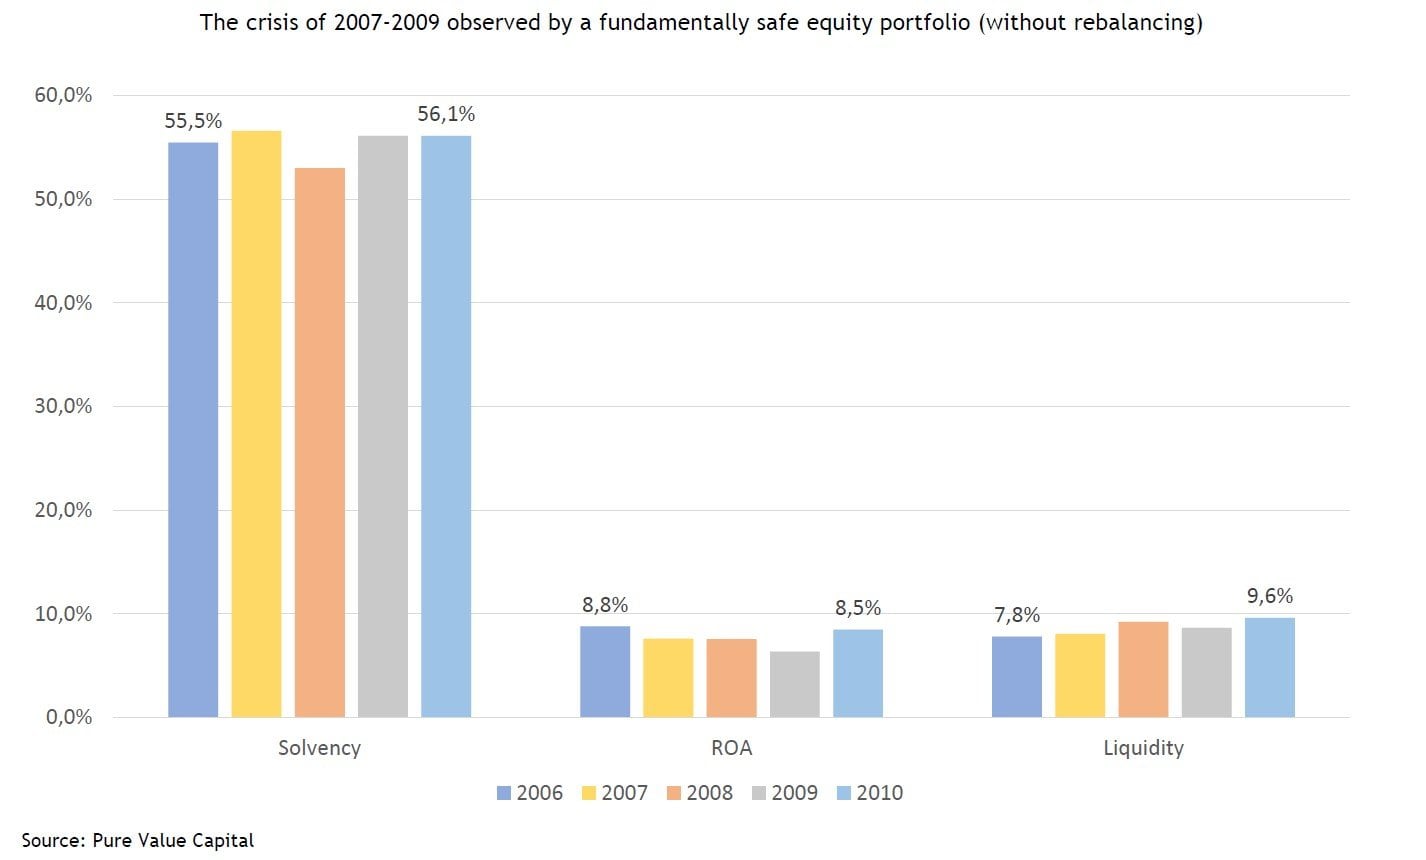
In this respect it is good practice to have a look at the evolution in the fundamental strength (solvency, profitability and liquidity) of our portfolio composed at the end of 2007 over the 2006-2012 period without applying any rebalancing over this time period. In the graph on the next page we show the evolution in the median solvency, profitability and liquidity of the firms in the portfolio at the end of 2007. For two out of the three financial metrics we observe a decline during the 2007-2009 crisis where obviously the largest drop is for the return on total assets. However conform the aforesaid view expressed by Graham we see no significant deterioration in the fundamental strength of the median firm during the most severe economic and financial crisis since the Great Depression. Based on the numbers in the graph it is very difficult to infer that the 2007-2009 period was both economically and financially extremely stressful.
From this section we remember that thanks to consciously selecting fundamentally safe stocks – low valuation risk, low credit risk – during stock market corrections investors can largely rely on the intrinsic value of their capital. Hence downward emotion-driven volatility is no longer a risk to be afraid of, on the contrary it creates opportunities to invest new cash flows or liquid assets at lower valuations and to realise on average higher long term investment returns.
Conclusion
“Through all its vicissitudes and casualties, as earth-shaking as they were unforeseen, it remained true that sound investment principles produced generally sound results. We must act on the assumption that they will continue to do so.
Anno 2019 we find that intelligent investment principles are as relevant as in 1949 – when the above quotes were written down. Based on previous insights and rigorously paying attention to the corresponding lessons we are convinced that the anxiety in case of negative annual returns can be removed and can make way for a more assertive, rational and in the long run more profitable attitude towards (downward) stock price fluctuations.
Coming Events
On January 31, 2019 and February 11 we will stage two events taking place at Saffelberg Castle. Enrolment can be done through the email addresses given below. These events will focus on five timeless yet simple investment principles ensuring that the long term component of your wealth will be safely put on the rails. In the spring of 2019 at the KU Leuven we will organise a seminar around these investment principles. In due time we will keep you posted! Do not hesitate to contact us in case you have questions.


