McIntyre Partnerships commentary for the third quarter ended September 30, 2018.
Performance Review – October Selloff
For purposes of consistency, the following performance review will be focused on the partnership’s year-to-date through September. However, I would be remiss to not mention October performance – down 10%. This compares to the S&P 500 and S&P 600 October returns of -7% and -10%, respectively. While hardly ideal, the partnership’s stated risk goal is to match market performance during a rapid selloff, with the subsequent goal of significant outperformance in a fundamental downturn. The fund is concentrated and runs close to a 100% net exposure. When the market rapidly drops, most securities drop in tandem; ours will most often not be an exception. I am not pleased with the results, but I am satisfied that we met our risk goal.

Q3 hedge fund letters, conference, scoops etc
Performance Review - Q2 2018
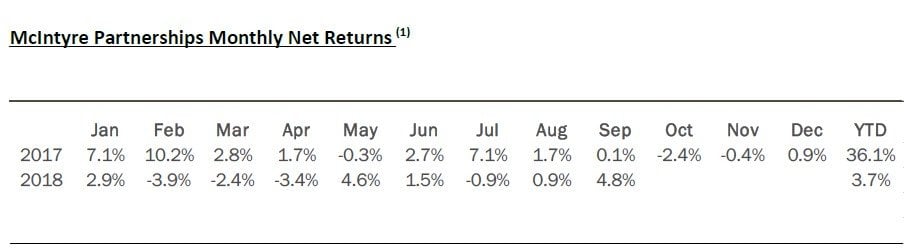
Through September, McIntyre Partnerships returned 5.3% gross and 3.7% net. This compares to S&P 500 and S&P 600 returns including dividends of 9.0% and 14.5%, respectively.
Year to date (YTD), our performance remains consistently behind the indices, without substantial winners or losers. I have little to say beyond that this year remains frustrating.
In Q3, we had no >100bps losers. In the win column, LILAK, our “media basket” (CBS and DISCA), PRSP, and SMTA each contributed ~100bps in the quarter. YTD, our only significant loser is CC, which has lost slightly more than 100bps. Our largest YTD winner is our “media basket” (~250bps), while DDS and SMTA each contributed ~100bps.
Portfolio Review - Exposures and Concentration
As of September end, our exposures are 132% long, 36% short, and 96% net. Our five largest positions were 74% gross exposure and our ten largest were 110%.
Our five largest positions are CBS/DISCA, LILAK, SMTA, CC, and uranium.
~64% of the portfolio is what I would consider a non-cyclical business (cable, beer, cell towers, etc.).
~36% of the portfolio has a “hard catalyst” (spinoff, merger, asset sale, etc.), while another ~41% have “soft catalysts” (earnings beats, price increases, etc.).
Portfolio Review – Existing Positions
GOOGL, PRSP, and Small Cap Financials
We exited our investments in GOOGL and PRSP and significantly reduced our small cap financials basket, solely to reallocate capital toward what I consider better investment opportunities. All were modest outperformers YTD, and I could see reinvesting in all at a later date. However, given the significant declines in certain cyclical industries, I believe our capital is better allocated elsewhere.
FBHS
FBHS shares were relatively flat in Q3, but the stock fell significantly in October and is now down ~40% YTD. The fall has largely been driven by sentiment rather than significant EPS reductions. In January 2018, the consensus FY2019 EPS was $3.90 and shares traded at $70. Today, FY2019 estimates are still $3.90, yet shares trade at $43. When I entered the position, my plan was to be a sizeable yet not maximum-sized position and to add if the stock fell toward $40, and I have increased our position accordingly. While recent results were modestly disappointing (FBHS lowered comparable FY2018 estimates by 4%), nothing in the results has changed my belief that FBHS is a “blue chip” quality business with only modest cyclicality around new housing and rising interest rates.
More broadly, I believe FBHS, along with our new investments in GTX and CC, has been punished in the market due to a general panic in cyclical stocks, discussed below.
Opportunities in the Current Selloff
"You have to recognize that every ‘out front’ maneuver is going to be lonely. But if you feel entirely comfortable, then you’re not far enough ahead to do any good. That warm sense of everything going well is usually the body temperature at the center of the herd. Only if you’re far enough ahead to be at risk do you have a chance for large rewards." - John Masters
“What an investor needs is the ability to correctly evaluate selected businesses. Note that word ‘selected’: You don’t have to be an expert on every company, or even many. You only have to be able to evaluate companies within your circle of competence. The size of that circle is not very important; knowing its boundaries, however, is vital.” - Warren Buffett
“George Soros has a philosophy that I have also adopted: the way to build long-term returns is through preservation of capital and home runs.” - Stanley Druckenmiller
The above quotes are some of my favorites on investing. Combined, they summarize my investment strategy: a contrarian value approach, thorough and accurate analysis of specific investments, and concentrated swings at “fat pitches.” For the partnerships to have exceptional returns, we must be willing to invest in unconventional ways, in particular when it is uncomfortable and others are fearful. However, simply swinging at every scary-looking, contrarian investment is not a rational or winning strategy. A “fat pitch” investment is not just one with a lot of upside; it is one where the market has also materially mispriced its long-term risk.
I believe the recent market turmoil has created “fat pitch” opportunities. In certain cyclical industries, such as autos, housing, and materials, there are dozens of stocks down 30% to 50% (or more) in a span of only a few months. In my experience, when entire sectors experience rapid, correlated declines, it’s highly unlikely every stock in the space was massively misvalued a mere few months ago. In such volatility, one can hope to find specific investments that have fallen too much – the proverbial “baby with the bathwater.” I believe I have identified a few of these. However, I am clearly early to the investments and the stocks are currently volatile and heading lower. In effect, I am increasing the probabilities of short-term gains or losses at the fund, though I strongly believe there is little risk of permanent loss of capital over the medium- or long-term. Partners thus deserve an explanation of how I am approaching these new investments, particularly around risk management. What follows is a brief explanation of how I approach market selloffs and cyclical investments, which is followed by our standard “New Positions” section.
Market Selloffs Strategy
I never attempt to time, trade, or anticipate a market selloff. Instead, my goal is to create a portfolio that should not drastically underperform in a rapid decline and then hunt for bargains in the carnage. I avoid filling the portfolio with high beta stocks so we have “dry power” when the hunting is good. However, if a selloff falls 10-15%, I am generally comfortable increasing exposure to stocks with higher beta as the market rarely correct more than 30%. Since 1945, the S&P 500 has had 40 greater than 10% selloffs, yet only eight greater than 22% and only five greater than 30%. Buying within 10% of the bottom is good enough for me, and I am not in the business of placing bets that are 7:1 against and occur once every 15 years.
Cyclical Investing Strategy
My general approach toward cyclical investing falls under two strategies: buy when 1) stocks are priced attractively and I have a non-consensus view on the near-term cycle (i.e. a 7% or higher earnings yield and the cycle will positively surprise in the next 6-12 months), and/or 2) stocks are priced attractively even if the cycle materially deteriorates (i.e. a 7% or higher earnings yield on trough assumptions). Both strategies have simple logic.
For Strategy #1, cheap stocks that positively surprise tend to go up (“Captain Obvious” comment) and the near-term catalyst provides a relevant “moment of truth” to exit an investment if proven wrong, which limits downside. Our investment in uranium falls under this category.
For Strategy #2, I am betting the stock eventually reverts to the mean and the cheapness on trough assumptions limits mark-to-market downside. However, the latter assumption is more hope than anything, as price and logic sometimes diverge materially, particularly in a panic. If I am buying a liquid stock at $10 that I believe has trough earnings power of $2 or more, it goes without saying the person selling it to me strongly disagrees with my assessment, often so much so that the seller is indifferent between $10 and $7. For this reason, I focus our Strategy #2 investments on high-quality companies with deep moats and limited secular change – i.e., businesses where it is improbable the fundamental earnings power can change beyond cyclical ups and downs. Our investments in GTX, CC, and FBHS fall here.
Portfolio Review – New Positions
Uranium (via Uranium Participation Corp. and Yellow Cake PLC)
Our investment in uranium is a slight anomaly from our typical investments – we are investing directly in a commodity rather than an equity or debt security. While I typically prefer investing in companies, reversion to the mean commodity investments, such as our uranium bet, are one place where I favor the underlying commodity. My reasoning is that it simplifies the bet and that it’s often difficult to find high-quality companies with correlated exposure. For uranium specifically, almost all public plays on uranium are mining companies, which I consider a generally bad place to invest. Miners spend huge sums with multiyear cash burns based on prices today, only to often find the price materially lower by the time the mine is ready to produce. Instead, we have acquired shares in two uranium holdings companies, similar to exchange-traded notes (ETN), who have no operating business and whose only assets are physical uranium.
My uranium thesis is simple: Spot prices are well below marginal cost, implying an inevitable reversion to the mean, and significant capacity was closed this summer, providing a catalyst for higher prices over the next six to twelve months. Uranium is a relatively simple market with predictable supply and demand over time. On the supply side, uranium is directly mined (i.e., not a byproduct), with capacity clustered in a small number of large players. On the demand side, the end use is power generation, where the number of reactors is trackable and utilization relatively constant across the economic cycle. However, the challenge in analyzing uranium is that there are large, opaque global inventories. Governments and utilities stockpile multiple years of inventory, typically without public disclosure, and the line between strategic reserves and available-for-sale inventory is blurry. This inventory opacity is always part of uranium markets but was further complicated by the Fukushima disaster in 2011, after which Japan shuttered all its nuclear capacity, effectively turning off 15% of global demand and flipping the market into significant oversupply. However, only 20% of the uranium market is spot sales; most supply is provided under long-term contracts. Uranium miners thus continue to operate profitably and sell at prices 50-100% above current spot, with any excess crushing the spot market. As a result, spot uranium prices have traded in the low-to-mid $20s per pound for the last three years compared to a marginal cost of $40/lb. on current mines and a $50/lb. price needed to incentivize new supply.
I believe uranium prices are set to rally significantly in the short- and long-term. In the short term, the two largest uranium miners indefinitely idled significant capacity this summer, representing ~20% of global supply. As a result, the uranium market will be in a deficit for the first time in a decade. I believe prices must return to at least $35/lb. for the mines to be restarted, which would require a lead time of approximately six months. Long term, the majority of global demand will become uncontracted in the next five years, with significant uncontracted demand starting in 2020. The end of long-term contracts will either result in higher spot prices or mine closures… which then would drive higher prices.
Since we initiated our uranium position, prices have rallied 10-20%.
Garrett Motion (GTX)
I found our GTX investment in a place where one could hope for a bargain: a complicated, recent spin of a small-cap from a mega-cap where the relevant peer group fell 30-50% in the two months preceding the spin. I think of GTX on two levels: a bet on auto suppliers broadly and a bet on GTX specifically.
Auto stocks are one of the worst performing sectors YTD, with the auto supplier subgroup falling ~35% and trading at ~7-8x 2019 EPS. Global auto purchases have begun to slow, lead by a low-double digit decline in China, and memories of the 2008 recession linger. Further, the evolution of battery electric vehicles (BEVs) requires a change in the auto supply chain, adding a degree of secular risk. However, I believe certain auto stocks more than reflect these cyclical and secular risks. While certain markets can exhibit substantial cyclicality, global auto demand is more robust, with a peak-to-trough decline of ~10-15% in the Great Recession. BEVs are a long-term concern, but a very long-term concern versus current valuations. BEV penetration is presently minimal and the combined internal combustion (ICE) and hybrids market is unlikely to decline until at least the late 2020s. The subgroup’s teens FCF yield more than reflects the prospect of a substantial decline beyond 2030.
GTX is a leading manufacturer in the moat-rich turbocharger (TB) market, with a global end-market, industry leading margins, and a strong medium-term growth story from hybrid penetration. GTX was recently spun from the much larger Honeywell. As GTX represented under one percent of HON’s equity value, I believe most HON shareholders sold their shares with little research or regard for price. GTX shares now trade at ~3-4x my estimated 2019 FCF/share, the lowest multiple in the auto-supplier space. I believe investors are ignoring GTX due cyclical fears and GTX’s asbestos liability, which makes GTX screen as highly levered. Auto suppliers are inherently cyclical, but GTX has a global end-market, an 80% variable cost structure, and the TB market is forecast to grow ~500-600bps above the market rate, which lowers GTX’s operating risk in a recession. GTX screens as having ~$3.2B in debt/liabilities versus ~$650MM in 2018 EBITDA, but ~$1.4B of the debt/liabilities is the asbestos liability, which is structured as a junior obligation with an $175MM annual cap that can be deferred in the event of default. GTX only has ~$50MM in annual interest expense and ~$25MM in maintenance capital needs, implying substantial coverage versus “true” fixed costs even in a significant recession.
I believe GTX can earn >$4 in EPS in 2020 and, as the stock delevers and the story is better understood, can trade at a 10x or better valuation. The fund target’s a substantial position.
Chemours (CC)
I have written about CC before, but I will provide a brief background for new investors. CC is the business and stock I know better than any other in the market. It is one of the highest quality, durably competitive advantaged companies I have ever analyzed. I personally have been a shareholder since fall 2015, and we had an ~25-30% position when the fund began trading in January 2017. We entered the year with a small position. Given the stock’s 40% fall since June, we have considerably increased our position.
CC is chemical manufacturer, primarily of TiO2 and fluoroproducts. It was spun from DD in summer 2015 with a plethora of balance sheet, cyclical, and legal headwinds. Those risks have since been addressed or proven exaggerated, and the stock rallied significantly in 2016 and 2017. The story has been different in 2018. Material stocks broadly have fallen ~20%, while CC and other TiO2 companies have fallen 50% or more. CC now trades ~5x 2019 EPS, implying the market believes earnings have hit a cyclical peak, a recession is coming, and EPS is likely to decline significantly in the near term.
While I do not have a strong view on the odds of a recession, I believe the market is substantially overestimating the cyclicality of CC’s earnings, which should be greater than $3 per share at trough and mid-cycle between $4-$6 versus a current share price of $30. I believe the market is treating CC as a generic TiO2 producer, which ignores 1) CC’s significant cost advantage yields substantial profits even at cyclical bottoms and 2) half of CC’s EBITDA is generated from flouroproducts. On cost advantage, CC has a substantial scale advantage as well as a proprietary process, uncracked for 70 years, which results in an ~$300/ton cost advantage versus peers. For comparison, TiO2 peers average ~$300/ton in EBITDA-capex over a cycle. On fluoroproducts, the segment is significantly less cyclical than TiO2 and has a strong growth driver in Opteon, its next generation refrigerant, which should drive high single-digit to low double-digit growth in the next few years.
With CC shares down 40% and trading 10x trough and 5-8x mid-cycle, I believe CC is substantially undervalued for a growing, low-cost producer.
As always, please feel free to contact me with any questions.
Sincerely,
Chris McIntyre
This article first appeared on ValueWalk Premium


