
Third Point letter to investors for the third quarter ended September 30, 2018.
Review and Outlook
In the hit NBC television show The Good Place, (spoiler alert!) the audience is led to believe that a group of people who led righteous lives arrive in a utopian village where they are given the homes of their dreams to live in, are matched with their soul mates, and can eat endless amounts of frozen yogurt and never get fat. Eventually, the characters learn that their “soul mates” were chosen in error and that the angel played by Ted Danson was actually an evil demon who concocted the scenario as a way to torture them. Turns out, the “Good Place” was actually the “Bad Place.”
Looking back, it has become clear that we and many investors thought earlier this year that we had arrived at the “Good Place” in terms of market conditions. In January, fueled by tax cuts and synchronized global expansion, PMIs rose, economic growth estimates were revised upwards along with corporate earnings, and stocks surged across the board, especially growth stocks. Then, in February, volatility spiked to record levels and stocks dropped precipitously after a series of technical dominoes fell into place. After October’s market rout, it seems that the environment this year ought to have been dubbed the “Bad Place Market.”

Q3 hedge fund letters, conference, scoops etc
Underperformance forces us to take a hard look at how our process let us down and, in this letter, we will try to share with you what we think has gone wrong this year and what could still go right. Writing about the Third Quarter after the past few weeks seems useless, so instead we will explain why we think the sell‐off happened, what we missed, and what we think comes next in the markets and for our portfolio.
First, while the S&P is up slightly for the year, this statistic belies the extremity of the moves at the sector and global levels. Year‐to‐date, retail is up 30%, tech hardware is up 20%, and healthcare equipment is up 20%. By contrast, autos is down 18%, materials is down 8%, and capital goods is down 7%. At the lows, 63% of global stocks had entered into a bear market, which is almost equivalent to the 70% level reached at the 2011 and 2016 index lows. Rotation among sectors and industries has been violent, with the share of sectors recording extreme moves at the highest level since Trump’s election.
We believe the initial sell‐off was caused by a backup in interest rates that saw 10‐year yields rise from 2.8% at the end of August to 3.2% by the beginning of October. While equities and yield tend to move together over long periods of time, fast rate moves can cause equity declines in the short‐term. Rates were driven higher by Fed Chair Powell’s commentary that spooked the market into quickly projecting the worst‐case scenario, i.e. that a tightening overshoot would drive an otherwise buoyant economy into recession. These fears manifested themselves initially in the de‐levering of growth stocks, causing volatility to rise and the market to breach levels to the downside, driving systematic and quantitative strategies to accelerate selling in a window of time where corporates were not participating in buyback programs due to the blackout period. At the same time, a string of weak earnings pre‐announcements made investors question what had been a firewall for the S&P until that point. Strong earnings had allowed the S&P to withstand headwinds from weakening growth abroad and escalating tariffs, which had already driven most ex‐US markets lower this year.
It always seems like the perfect storm in hindsight. Weakening earnings plus trade war escalation plus a potentially overzealous Fed was a toxic combination, particularly for cyclicals. Clearly our job is to stand in the eye of the storm and understand how much and for how long sentiment can trump what we still see as solid fundamentals for growth in the next year.
While current US growth remains above‐trend, helped by fiscal stimulus, this positive impulse is peaking now, and will combine with an increasing drag from tightening financial conditions. This means that current above‐trend growth will slow over the next year. Growth outside the US is tepid, driven by Chinese tightening still percolating through the system as markets wait for the country’s recent stimulus to take effect. While these two together imply stable growth for now, the direction in 2019 will be driven by the interplay of slowing US growth and the extent to which Chinese stimulus can lift non‐US growth.
Continued slowing seems more likely than reacceleration but the US economy should grow at trend. Given lack of financial imbalances and limited signs of an outbreak in inflation despite low unemployment, we still do not see any signs of an impending recession.
Thus, it is important to stay balanced and not get overly negative. The market has just been through its sharpest P/E multiple de‐rating since the 2011 sovereign debt crisis. While the current 10% consensus EPS growth forecast for 2019 is probably too high, the current multiple of 16x is already discounting cuts to the 2019 consensus. On the upside, delivery on 2019 consensus EPS and a return to the pre‐sell‐off multiple, which would still be below the peak 18x multiple in January, would imply ~8% upside. The biggest risk at these levels is immediate weaker economic growth, which in extremis could cause a recession, thereby driving down markets more substantially as both earnings and multiples would fall.
We have delevered our portfolio, reduced our tech exposure meaningfully, and grown our short book. We expect to be net sellers over the next few months if markets rally but, while we recognize that we are far along in the cycle, late‐cycle and end‐cycle are not the same. Volatility will remain high versus recent history and, while we have officially graduated from the post‐financial crisis “buy the dip” paradigm, we think the strength of the US economy combined with the lack of significant inflationary pressure or structural imbalances still favors higher equities from these levels. At ~16x one year forward P/E for the S&P500, valuations are not overly demanding, especially when considered relative to real rates of 1.0%, which imply an above‐average equity risk premium.
While the prism through which we seek out our longs has not changed, we are increasing our focus on stress testing cash flow, asset productivity, and the interplay of rising rates to balance sheet strength and financial flexibility. From our vantage point, the debate around what is value (e.g. the index, the factor, sectors) versus growth loses sight of our aim to identify compounders of value. To that end, we increasingly will be doubling down on finding quality‐driven ideas, namely those with strong relative growth prospects, solid financial returns, and appealing relative valuation vis‐à‐vis their cash flows, peers, or the market.
As a firm, we continue to invest in the integration of our fundamental process and the “Rise of the Machines” across our single name, sector, and portfolio positions. We remain excited about the application of alternative data insights into long and short investments. Over the next few months, we will focus on further evolving our “quantamental” process to aid in portfolio selection, construction, and hedging. We see opportunities to shape our portfolio borne out of a more thoughtful understanding of the derivative markets, passive and quant flow impact, cross asset signaling, and how investor behavior sometimes creates extremes in positioning. We have seen again over the last month what the new era in quant and ETF-driven markets looks like and we are determined to evolve in order to thrive as fundamental stock pickers in this environment. Led by our new Managing Director, Bob Boroujerdi, we will focus more on these areas to ensure we avoid errors of commission and omission, seek out mispriced assets, and optimize sizing. Finally, we are focused on layering in additional systematic capabilities to identify capital structure opportunities and leverage our experience in ESG more robustly.
Quarterly Results
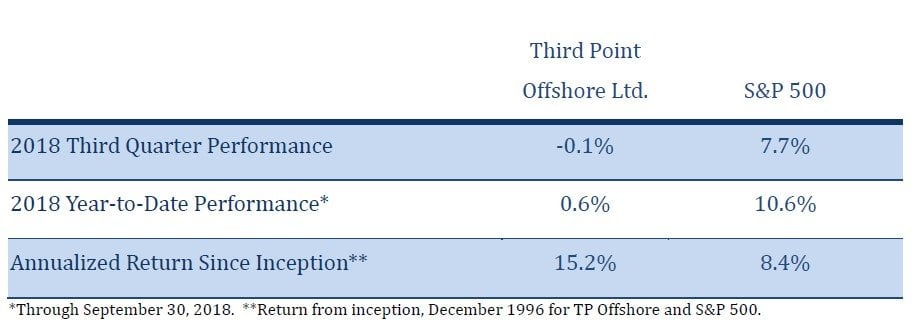
Set forth below are our results through September 30, 2018:
New Position
American Express
American Express (“Amex”) is a ubiquitous franchise, with 115 million cards‐in‐force and $1.2 trillion of billed business, making it the fourth largest payment network globally. It is also a franchise that appeared to lose its way in recent years. From 2014‐2017, Amex lost co‐brand relationships with JetBlue and CostCo and saw increased competition from Chase’s Sapphire Card; EPS growth halved; and shares underperformed the S&P 500 by ~40%. We think this challenging period galvanized the franchise, forcing necessary investments and a strategic pivot that is just beginning to pay off. New CEO Stephen Squeri is re‐energizing Amex by focusing on topline growth and under‐appreciated structural opportunities in Commercial and International – efforts we think will lead to more sustainable double‐digit EPS growth going forward.
Amex has a significant opportunity to sustain higher revenue growth as it prioritizes investments that drive customer acquisition, card acceptance, and higher average spend. This is a long runway where Amex is just beginning to inflect after years of under‐investing. Proprietary card acquisitions hit 3 million last quarter and total cards rose 7% Y/Y – the strongest user growth in a decade. Merchant acceptance is growing at a high single‐digit pace, twice that of Visa/MasterCard, and Amex aims to reach virtual parity with the latter networks by the end of 2019. Average spend is also scaling with the merchant network, as Amex reaches across demographics, with Millennials making up half of new Platinum customers, and deeper into member wallets, with 60% of loan growth coming from existing account holders. Overall, management has re‐prioritized share, scale, and relevance – a formula that is driving billed business and net revenue growth of >8% the past 5 quarters, nearly twice the average pace of the past two decades.
As part of its strategic refresh, Amex also re‐aligned operating segments earlier this year to better execute on the structural growth in Commercial and International payments. Today, Global Commercial Services (“GCS”) is Amex’s fastest‐growing segment, with billed business up 12% Y/Y, and a close #2 in scale and profitability to Global Consumer. In large corporate, Amex has relationships with >60% of the Global Fortune 500; in SME, Amex is larger than the next five players in the US combined (by spend). While Wall Street tries to find the next high‐multiple stock to monetize the shift in B2B payments – an area with ~$20 trillion of addressable spend and ~10% penetration – they are missing a more obvious beneficiary in American Express, where B2B already makes up 2/3 of commercial spend. No one is better equipped to monetize the opportunity than Mr. Squeri, who previously ran Amex’s Commercial division. The recent partnership with Amazon to offer co‐brand cards to small businesses is testament to Amex’s positioning in the commercial market.
Amex also has a structural growth opportunity as it presses its unparalleled value proposition in less competitive international markets. International SME and Consumer, which together are nearly 1/5 of total billings, are now growing proprietary billings at ~18% Y/Y (FX‐neutral). In International SME, Amex is just scratching the surface, with <5% market share in each of its eight core markets – seven of which are now growing doubledigits. In International Consumer, Amex has an opportunity to boost wallet‐share with highincome spenders and has now grown billings by over 10% for eight consecutive quarters – double the pace of the previous five years. Finally, the growth is less about cyclical tailwinds than greater operating focus: both Commercial and International are growing proprietary cards‐in‐force at more consistent levels (up 3% and 6%, respectively) and at higher average spend per card than has been seen before.
Ultimately, greater scale – in users and acceptance, across commercial payments and international markets – has the power to drive operating leverage and more sustainable EPS growth over the long‐term. Critical to this equation is Amex’s spend‐centric model, where fees are 80% of revenue, about 3‐4x the level of a “traditional” card company, and credit costs are just 1/5 the cost of total customer engagement spend (marketing, rewards, service) with the latter providing an important lever to throttle back and help sustain earnings in tougher times. Indeed, one thing that has stayed consistent with new management is the ability to contain costs, with OpEx roughly flat over the past year, even as Amex achieved double‐digit billings across its 3 major segments. With shares trading at just 12.5x our 2019E EPS, and 11x 2020E EPS, we think markets under‐appreciate the strategic pivot occurring at Amex and see shares trading above $135 over the next 18 months for a total return of 30% upside.
Sincerely,
Third Point LLC


