RGA Investment Advisors commentary for the third quarter ended September 30, 2018; discussing their investment in PayPal.
The second quarter was outstanding for our portfolios; however, the market absolved us of the opportunity to take comfort in those results rather swiftly. While this is our third quarter writeup and we typically confine this space to a discussion of the events during the course of the titled quarter, we feel it is important to address the market’s gyrations thus far in the fourth quarter.
Seemingly on a dime, market sentiment changed from fairly constructive to rapidly destructive. When markets enter a period such as this, we attempt to identify the excuse. For most of the October selloff, there were a multitude of explanations ranging from China to interest rates to housing to Italy to tariffs. We try to know the prevailing narrative as to why the market is dropping, because once we get a sense for the why, we can then hone in on assessing the impact:

Q3 hedge fund letters, conference, scoops etc
- How big a risk is it? Can we quantify the effect on the economy and most importantly, our core holdings?
- Has the market already discounted the extent of the potential risk?
- Is there a way for policymakers (whether that be politicians or the Fed) to fix the problem?
- How does the specific threat come to an end or come to pass?
The Federal Reserve’s interest rate hiking cycle has certainly caused concerns, specifically in housing. The selloff started alongside the long end of the interest rate curve steepening and rates moving higher. While this certainly matters, we would caution reading too deeply into the impact, especially considering the fact that before the selloff hit its most extreme levels, much of the long end interest rate move had already reversed.
We think the foremost reason for this October selloff has been the impact of the trade war with China. This has been evident throughout earnings season, where companies talked about the drain the tariffs have placed on margins and the uncertainties the entire trade war with China engenders over years of supply chain strategy and investment.[1] Although investors had time to prepare for these potential problems, we think far too many expected them to pass before visibly seeing any impact in earnings. Further, while the effects themselves are rather modest in what we would call the largely insular US economy, they are rather pronounced in the earnings of global multinationals—exactly the kind of companies which populate the S&P 500.
For years, manufacturing companies built their processes around at least some degree of Chinese production capability and with that imperiled, it places a severe stress on planning and willingness to invest going forward. While housing seemingly is an interest rate story, there also is a degree of Chinese tariff risk: in some talks with homebuilders, we heard that relatively small costs like lighting fixtures have seen price increases upward of 20%. If several of these small costs jump apace, homebuilders must face several tough choices concurring with a rise in interest rates. Do homebuilders raise prices? That might be tough for the market to swallow. Do homebuilders accept lower margins? Shareholders certainly don’t like that. Do homebuilders push down the feature-set of new houses to lower their cost base? That’s certainly a realistic possibility which results in less overall demand for product generally.
We have referenced Michael Mauboussin’s distinction between uncertainty and risk in the past:
“Risk: We don’t know what is going to happen next, but we do know what the distribution looks like. Uncertainty: We don’t know what is going to happen next, and we do not know what the possible distribution looks like.”[2]
Here we know there are distinct risks and this past earnings period saw them quantified. We also must cope with the uncertainty of not knowing directionally how investment strategy will be engineered going forward for companies with global supply chains. Given this landscape, early in this October, we sold our one holding with the most risk to these specific problems (Williams Sonomia, NYSE: WSM). The position had reached our sell range and the Trade War risks and uncertainty provided the right impetus to exit, reassess and move on. Beyond this one position, the rest of our portfolio has pockets of China risk and exposure though it is far smaller, more esoteric, and in no instance requires a major revamp of corporate strategy and planning.
PayPal: A core position for the long-run
PayPal has been and remains our largest position for years now. We commenced our position via eBay before the companies split in two in the summer of 2015. Since that time, much has changed at PayPal and the company has performed well; however, we think there continues to be an extreme misperception from Wall Street in analyzing the business itself. Specifically, analysis tends to be detailed and thoughtful, but lacking in creativity. Most analysts pick apart take rate every which way in an attempt to deduce underlying net revenue and gross margin trends, while the bigger picture opportunity is given little thought. We like simplifying an investment thesis to its essence and while take rate is certainly important here, we view engagement as the end-all, be-all metric to assess our investment in PayPal.
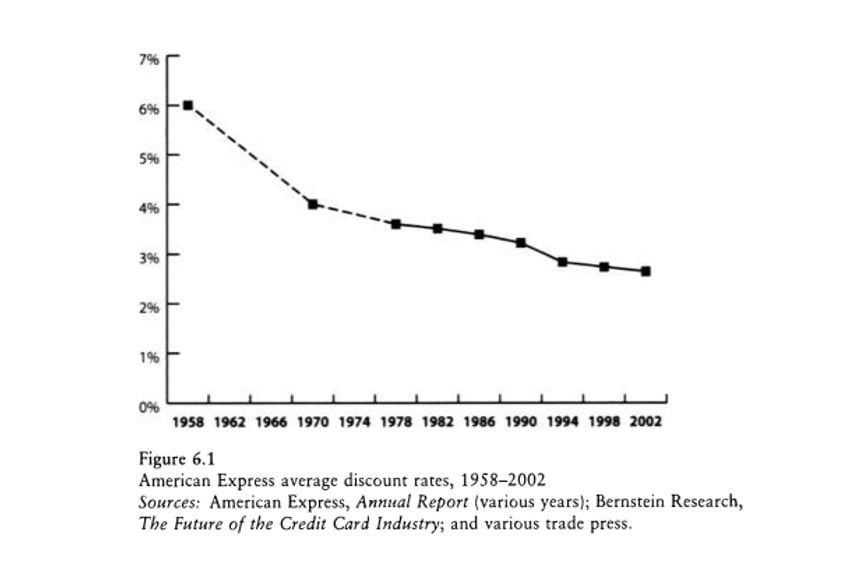
Let’s first take a step back and look at the “take rate” equivalent of some of our most important payment companies over time. First, American Express:[3]
Then Visa:[4]
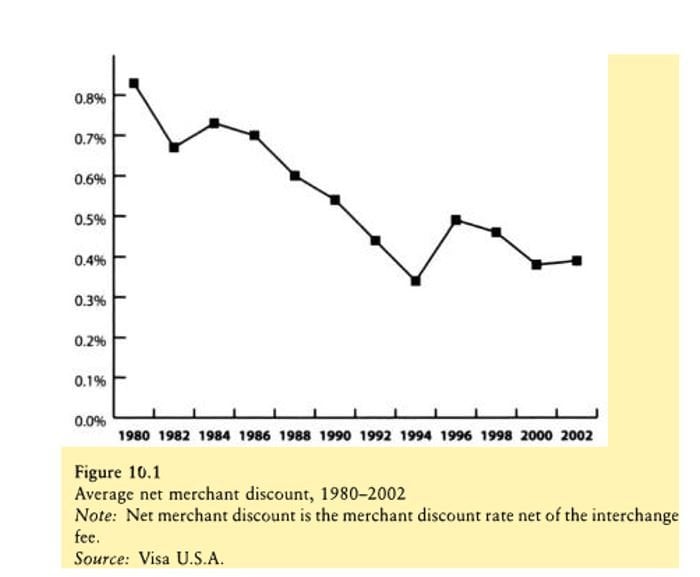
Note the persistent downward trend in the “take rate” of each American Express and Visa over the course of over 40 years in American Express’ case and 22 years in Visa’s case. These trends have persisted and meanwhile each company grew mightily during the covered timeframe and continues to enjoy a strong competitive position today. What force overcome these “take rate” headwinds? It was engagement—engagement in the form of an increase in usage by the average user. Let us now look at engagement trends over time at PayPal. Here are the most recent quarterly trends from PayPal’s Q3 earnings release:[5]
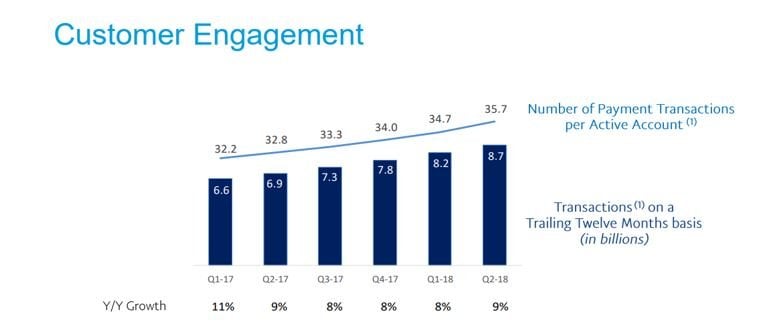
And here are the customer engagement trends going back to 2012:[6]
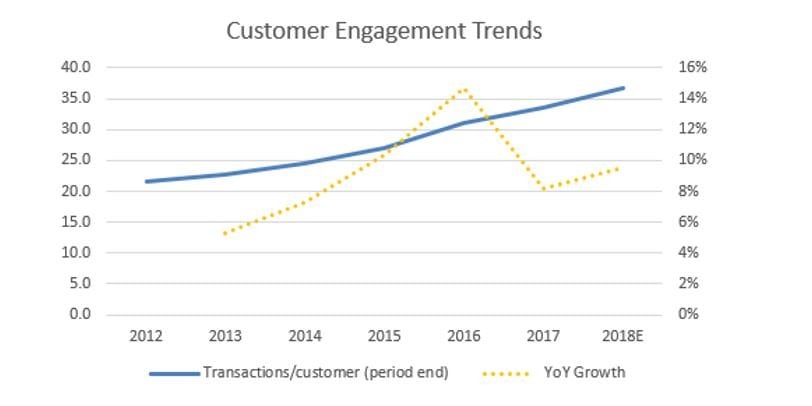
A few points are worth noting:
- In 2012, the typical active user at PayPal used the service once every 2.4 weeks, or less than once a month. In 2018, the typical user will use the service about once every week and a half, or a little more than three times a month.
- Notice the acceleration in engagement starting in late 2015 and early 2016. We attribute much of this acceleration to the benefits of independence from eBay with PayPal’s mission pivoting from driving sales on eBay to creating the ultimate consumer experience for online checkout. A singular focus on PayPal’s essence was crucial for driving meaningful improvements in the experience.
- Engagement growth pulled back in 2017 though this came from a step-change in the growth rate in new active users. In 2016, net new actives checked in at 10.06% vs 15.23% in 2017. The acceleration in growth was driven by “choice” following the Visa and Mastercard partnerships, enabled by easier onboarding and less friction throughout the user interface. New users take time to reach the engagement of more mature users. What’s notable is that the customer acquisition cost (CAC, measured by sales & marketing spend per net new user) dropped from nearly $54 to $37.60. In PayPal’s third quarter 2018 earnings report, CAC checked in at less than $36. Note: here we are looking at CAC on a net user basis, which overstates true CAC. Gross active user additions would account for churn. For the sake of this analysis we are focusing on simplicity.
- In 2018 the company will maintain its new user growth acceleration, while engagement growth re-accelerates.
Why is engagement so important? The significance is both qualitative and quantitative. Qualitatively, engagement is the purest measure of the value that active users are getting from PayPal. When engagement is rising, PayPal’s users are expressing the fact that PayPal’s service is more valuable and more useful to them. The extent of the rise is significant, as the average user thinks about the company more than three times as frequently on a monthly basis as they did five years ago. This increase in mindshare is important for how it influences the network effects operating within the business and forges a moat that will be impenetrable for the long run. The benefits with respect to the network are twofold:
- The more frequently the average customer uses PayPal, the more valuable accepting PayPal becomes to the merchant side of the network. More engagement thus leads to more merchant uptake.
- The more value each user gets out of PayPal, the more people who don’t yet use PayPal end up seeing reasons to engage with the company. In part, this is driven by peer-to-peer (whether it be core PayPal or Venmo) and in part this is driven by the positive sentiments the frequent users express because of their experience with PayPal. Users thus become PayPal’s best promoters.
The quantitative benefits are meaningful as well. Growth in customer engagement is more valuable and higher margin than growth in new actives. New actives require customer acquisition cost, whereas increasing engagement from existing customers has no such cost against it. New actives are obviously an important driver of top line growth & economic profit long-term; however, the Street consistently underestimates the importance of engagement as both a profit and margin driver. One way to think about this is to contrast the lifetime value (LTV) of a customer to PayPal with average engagement versus one with double the engagement.
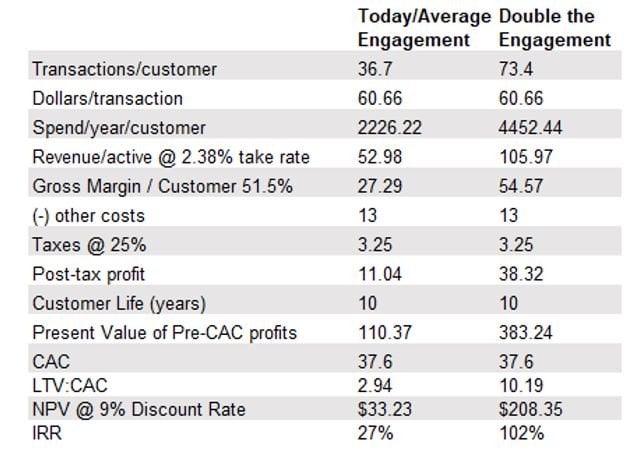
For illustration purposes, we used a 10 year lifespan, but note that the ratio of LTV enhancement would be the same were the lifespan 5 years. The “other costs” line above includes the full brunt of product development (R&D), customer support and operations and general and administrative expenses. We would make the case that much of the R&D line in particular goes towards growth investments and is not thus part of the individual customer economic value analysis; however, for the purposes of this illustration we are inclined to include it. The key takeaway here is that when engagement doubles, there is a nearly 3.5x improvement in LTV.
This is an important exercise for two reasons. First, while we can analyze averages across the enterprise, there are cohorts in PayPal who are far more engaged than others and these engaged customers are far more important for the overall value of the business. While PayPal does not disclose any number approximating churn, we must therefore make assumptions. Our assumptions can target the average, but it’s also important to think about cohorts. For example, were the 80% of PayPal customers extremely sticky with customer lifespans a decade or longer and the churn existent in the 20% around the edges, average/aggregate churn might be fairly high, while the LTV of the sticky 80% would be far greater than the LTV of the average. Second, if PayPal can continue to deepen engagement from its average customer, this would be a meaningful driver of value.
Between the big drop in customer acquisition costs starting in 2017 and continually rising engagement, the lifetime values of existing customers continue to trend higher at PayPal and the value of each incremental user continues to rise. Unlike the typical subscription service that has a price and sticks to it (or raises it modestly), PayPal enjoys two levers on the customer level that the typical SaaS within the LTV framework does not. We’ve spoken to engagement, but also the average transaction price itself rises at the rate of inflation. As inflation rises, PayPal’s unit economics improve at a faster rate than its expense base grows. Considering our ongoing theme of the economy normalizing and inflation returning to normal levels, this degree of pricing power is a powerful lever for the stock’s value longer-term. Once the analyst community realizes they can move past their fear of take rate erosion and embrace the powerful levers of engagement, the stock will be treated quite differently and far less skeptically by the investment community.
A Quick Comment on Walgreen’s:
Walgreen Boots Alliance entered the third quarter at its lowest share price in four years on the heels of Amazon announcing a late second quarter acquisition (on Walgreen’s earnings day no less). Amazon acquired PillPak, an online pharmacy with a differentiated offering.[7] We addressed the Amazon risk for Walgreen’s head-on in Elliot’s presentation at the Manual of Ideas Best Ideas Conference in January of his year.[8] While the market instantly focused on the risk, over the course of the quarter Walgreen’s shares recovered their lost ground and more. This offers an important lesson in sentiment.
While Walgreen’s sold off each time there were whispers of Amazon entering the pharmacy business, the materialization of an entry ended what has been a nearly two yearlong running speculation of the ecommerce giant’s intents. In the speculative phase, prognosticators allowed their imaginations to run wild with upside scenarios for Amazon and harsh consequences for the incumbents in Walgreen’s and CVS, with timeframes for these predictions seemingly irrelevant. Upon actualization however, the focus now must shift to execution. Before the PillPak acquisition, Walgreen’s the stock was fighting a perception battle with hypotheticals where price action was driven by narrative. Now Walgreen’s is fighting a competitive battle where market shares and margins will be the arbiters of success. On this front, Walgreen’s continues to gain share, though the company is sacrificing margin at the pharmacy to do so, while the front end continues to stabilize around a SKU rationalization and margin enhancement strategy.
Thank you for your trust and confidence, and for selecting us to be your advisor of choice. Please call us directly to discuss this commentary in more detail – we are always happy to address any specific questions you may have. You can reach Jason or Elliot directly at 516-665-1945. Alternatively, we’ve included our direct dial numbers with our names, below.
Warm personal regards,
Jason Gilbert, CPA/PFS, CFF, CGMA
Managing Director
O: (516) 665-1940
M: (917) 536-3066
Elliot Turner, CFA
Managing Director
O: (516) 665-1942
M: (516) 729-5174
[1] https://www.bloomberg.com/graphics/tariff-tracker/?srnd=premium
[2] https://ritholtz.com/2012/12/defining-risk-versus-uncertainty/
[3] Evans, David and Richard Schmalensee. Paying With Plastic: The Digital Revolution in Buying and Borrowing.
[4] Ibid.
[5] http://files.shareholder.com/downloads/AMDA-4BS3R8/6337674270x0x984282/B12A7275-E0EA-4AA4-BFF0-EB5FB5A613A6/Investor_Update_Third__Quarter_2018_Final.pdf
[6] Sentieo data, RGA Investment Advisors analysis and estimates
[7] https://www.businesswire.com/news/home/20180628005614/en/Amazon-Acquire-PillPack
[8] http://www.rgaia.com/walgreens-boots-alliance-owner-operator-run-pharmacy-retail-leader/
Past performance is not necessarily indicative of future results. The views expressed above are those of RGA Investment Advisors LLC (RGA). These views are subject to change at any time based on market and other conditions, and RGA disclaims any responsibility to update such views. Past performance is no guarantee of future results. No forecasts can be guaranteed. These views may not be relied upon as investment advice. The investment process may change over time. The characteristics set forth above are intended as a general illustration of some of the criteria the team considers in selecting securities for the portfolio. Not all investments meet such criteria. In the event that a recommendation for the purchase or sale of any security is presented herein, RGA shall furnish to any person upon request a tabular presentation of: (i) The total number of shares or other units of the security held by RGA or its investment adviser representatives for its own account or for the account of officers, directors, trustees, partners or affiliates of RGA or for discretionary accounts of RGA or its investment adviser representatives, as maintained for clients. (ii) The price or price range at which the securities listed.
Article by RGA Investment Advisors
This article first appeared on ValueWalk Premium


