Why Market Data?
If you are not a certified psychic or in the mind of Bill Gates, your decision on whether or not to buy Microsoft stock cannot but be based on information that is publicly available. This does not mean you would have to read all newspapers in the world. It suffices to have access to live market prices, since they encapsulate in distilled form all available public information about the current state of economy. The last statement is true because market prices are the result of trading decisions undertaken by financial institutions that invest billions in constantly monitoring and analyzing all available information.
Why Live?
Investment success is based on the accurate prediction of the future.
The latter stands on two pillars:
- Realistic assumptions about the equation that presumably describes the evolution of the economy.
- Exact knowledge of the current market state, as this is what defines the starting point of every solution to the evolution equation.
Live market data are in effect the second of these two pillars.

Q3 hedge fund letters, conference, scoops etc
Why in Excel?
You need Excel for the first pillar of accurate prediction: Correct assumptions about the dynamics that drive the economy, simply because Excel … excels in that field as explained below. This in turn justifies adopting Excel for receiving live feeds as well, so that both pillars – assumptions and current market state – live in the same medium.
In investment practice you must usually apply some sort of predictive model. For example, one such model may be a charting rule whereby piercing through some support level would indicate further fall and command a sell decision. You may think these types of models are very sophisticated and cannot be easily built in Excel through built-in formulas and Visual Basic code. This is indeed the case, but nothing stops you from accessing these models through Excel, even if they are built elsewhere. Doing so, you will be able to build scenarios and tweak your model parameters in a much more flexible way than from within any other application. Excel is simply way beyond competition in this respect.
Ideally you would access both live data and predictive models within Excel so that you could add your own fully customized tweaks and switches to both data and models in order to reach your goal, which is no other than more predictive power and therefore more profit.
Eleven Criteria for the Ultimate Live Feeds Utility
Before I describe the methods of bringing live market data into the spreadsheet, I would like to present 11 criteria that an ideal live feeds provider in Excel should fulfil (ordered from more to less important):
- Geographic Coverage
It is imperative that the provider supplies the exact type of data you need. For example, if you are interested in Indian stock prices, you have nothing to gain from data feeds limited in prices of US stocks.
- Security Coverage
Most providers supply stock prices, but not all of them include market quotes on indices, interest rates, forex rates or cryptocurrencies. Fewer still offer prices of mutual funds, options, warrants and futures traded on the various exchanges.
- Set of Reported Data per Ticker Symbol
The so called “last traded price” is undoubtedly the most interesting number associated with a given ticker symbol. But there is more to it. Take for example MSFT, the NASDAQ symbol for the Microsoft stock. Right now I can see at the Yahoo Finance website the last traded price as $112.79. But there are other numbers as well, such as the pre-market price of $112.86, the previous close of $115.17, the percentage change of 2.07%, the volume of 81,702 and many more. Make sure the provider supplies at least those data that are indispensable for achieving your task.
- Time Delay
If you think that free data must be time delayed, you are wrong! Several exchanges distribute part or all of their data immediately as they are generated and often without charge. The typical case is IEX, the New York stock exchange launched in September 2016 that publishes all data in real time and free of charge. Another case is Yahoo Finance that sends out data in real time from 16 different exchanges according to this table.
In any case, it is important to ensure that the time delay associated with your chosen provider is within your acceptable tolerance.
- Update Frequency
Think of live feeds that convey stock prices with zero time delay but hit your spreadsheet every minute. Such feeds are clearly better than those that are updated every millisecond but present stale prices time delayed by one minute. This is why I have tagged Update Frequency as a less important feature than Time Delay. Nevertheless its importance on the quality of live feeds cannot be ignored.
- Reliability
The origin of all data is always the exchange where the transaction takes place. In most cases though, you will not receive your data directly from the server of the respective exchange. You will usually get them from the server of your live feeds provider, who in turn receives the data either directly from the exchange or from another provider. The data follow a route a bit like that followed by an email before it hits your mailbox. They change a lot of hands and things may go wrong in the process. So it is a good idea to inquire about any intermediate providers and check on their reputation as data distributors.
- Trust
Even if everything works perfectly today, the disaster may lurk behind the corner tomorrow! Best shocking example: November 1st 2017, the fateful Wednesday when Yahoo Finance suddenly discontinued their free, public API service sending thousands of users in a desperate hunt for replacement. The moral lesson: Never put all your eggs in one basket, no matter how reliable the basket looks today. Make sure you maintain data links with several different providers so that if one fails you can quickly switch to another.
- Ease of Use
You want the process dealing with the acquisition of live feeds to be as automated as possible. Ideally you would like to have some sort of monitor where you could inspect the current and past status and performance of the live feeds engine. If you notice, for example, that the displayed stock prices stay the same, it would be nice to be able to easily check whether this is due to some engine malfunction or to actual trading inactivity.
- Negative Side Effects
You may or may not notice them at first use, but they will often be there. For example, if the live feeds acquisition process runs synchronously with the main Excel thread, a big number of feed requests or sporadic connectivity problems may cause Excel to hang or slow down. Also if the acquired feeds are pasted as constants in the spreadsheet instead of being returned through embedded formulas, Excel’s native history buffer may become corrupted, thus invalidating the Undo/Redo capability.
- Extra Features
Any extra goodies (options, switches, customizations) made available by the application that serves the live feeds can be of interest and perhaps add value to your efforts. An interesting option, for example, could be the screening of bad feeds so that the most recent healthy feed is always displayed. While this option is not ideal for real time trading, it is very convenient for portfolio monitoring where you would rather see the most recent prices than no prices at all.
- Cost
I placed this one at the end of the list as I assume you are all very successful traders and you would not care about such trivialities! On a more serious tone, the cost for receiving live feeds varies dramatically among providers. It can be as low as zero (Investors Exchange) or as high as several thousand per month.
Accessing Live Feeds Method 1: Manual Download
The most straightforward method for bringing market prices in the spreadsheet is by visiting the website of the live feeds provider, which could be the exchange itself or some intermediary like Yahoo Finance and look for instructions for manual download.
Most providers allow their site visitors to download anonymously a so called csv file, which is just a text file that contains the desired data in tabular form, whereby the comma symbol “,” is used as a separator between the various numbers and text fields. The great thing about csv files is that they are automatically parsed by Excel so that a spreadsheet can be immediately created out of it without a helping hand from Visual Basic code.
While this approach may be sufficient for historical data that you only need to update once a day, it clearly fails to honor most of the criteria set out in this article.
Accessing Live Feeds Method 2: Native Excel Automatic Download
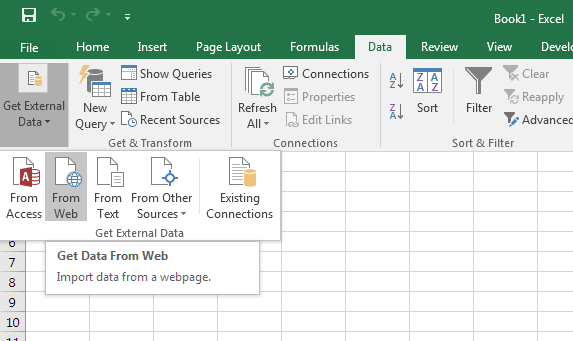
You may have heard that it is possible to bring in Excel any portion of data displayed on some website by clicking on the ribbon item Data and then selecting the From Web option from inside the Get External Data group, as shown below:
The result is a popup window that contains the current contents of a specified website. In my case, the site URL is initially set to google.com and appears like that:
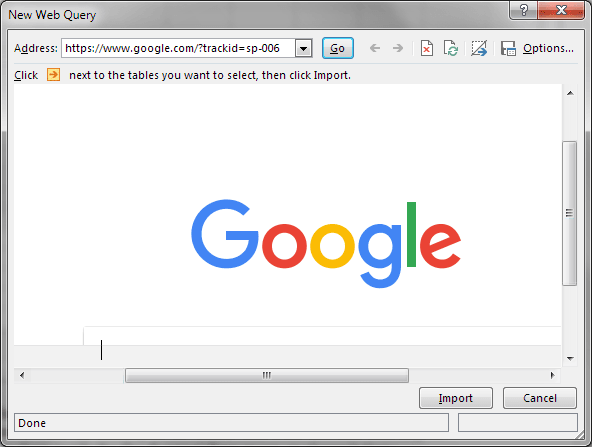
In theory, you are free to enter any URL you like in the address bar, select the portion you are interested in through the little orange arrow and finally click on Import to bring the selected portion into your spreadsheet.
Well, in practice things do not always work as expected. After I tried, for example, the URL https://finance.yahoo.com/quote/MSFT, I received several script errors with the end result being littering my spreadsheet with some multi-row text swirling words such as “unauthorized”, “deactivation”, “missing cookies” etc. Apparently Yahoo Finance is not being particularly conducive to giving out its data through this interface.
On the other hand, this approach works with several other websites. I have tried for example the URL https://www.marketwatch.com/investing/stock/live, which in my browser looks like that:
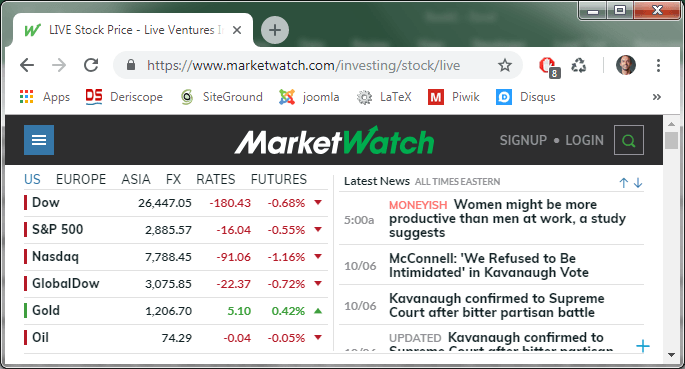
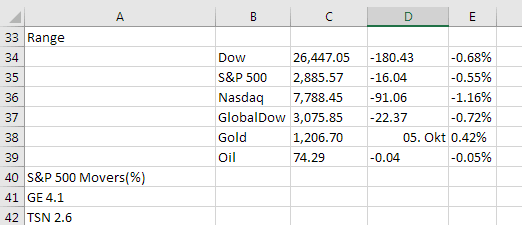
The data pasted in the spreadsheet occupy … 435 (!) rows and up to 5 columns, but at least I am able to locate the featured prices starting at row 34 in a descent tabular form as you can see here:
A useful feature of this native Excel web query is that you can set an automatically recurring refresh of the fetched data, albeit no more frequently than once per minute.
An obvious drawback is its reliance on the relative location of the various data within the website of the data host. If, for example, marketwatch decides to shift the S&P 500 quotes to the top row of the displayed data table, your automatic query will also shift the respective spreadsheet data one row higher, whatever this may mean for your formulas that link to those cells.
A second native Excel method is based on using the built-in formula =WEBSERVICE(url), where url is an appropriate web address.
For example, entering =WEBSERVICE("https://api.iextrading.com/1.0/stock/MSFT/quote/latestPrice") in any cell, will return the latest Microsoft stock price from IEX.
Provided it works, this is a great solution. But keep in mind that most sites, such as Yahoo Finance, do not provide URLs that can be used with the WEBSERVICE formula. Another drawback is that this function is not declared volatile, which means you would still need to write Visual Basic code if you want the returned feeds to be refreshed automatically.
Accessing Live Feeds Method 3: Programmatic Download
Since Excel’s API (Application Programming Interface) supports the connection to all possible applications, the absolute best solution is undoubtedly a specialized program that fetches the data from the provider’s server and displays them in the spreadsheet.
To a certain degree, writing such a program in Visual Basic is not very difficult. But if you rather focus on investing than code-writing, it might be easier to get a free or commercial utility that will do the job for you.
I am not going to list and compare all available utilities for two reasons: First because they can be easily found by a google search and second because my verdict cannot be impartial due to myself being the author of Deriscope, a financial Excel AddIn that can also process live feeds. Instead, I will use Deriscope as an example of how this task can be accomplished within Excel:
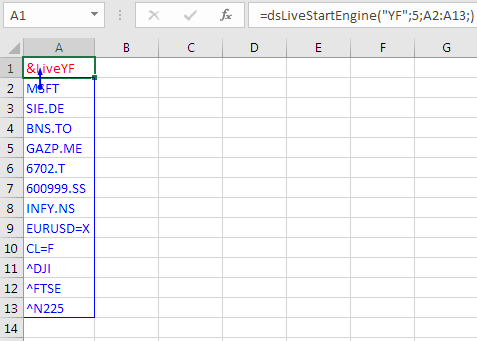
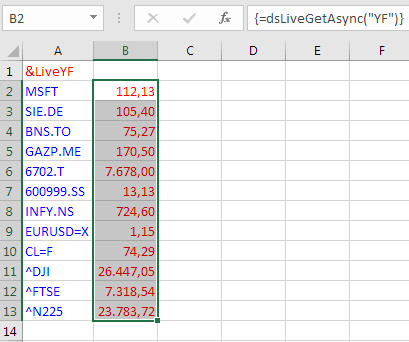
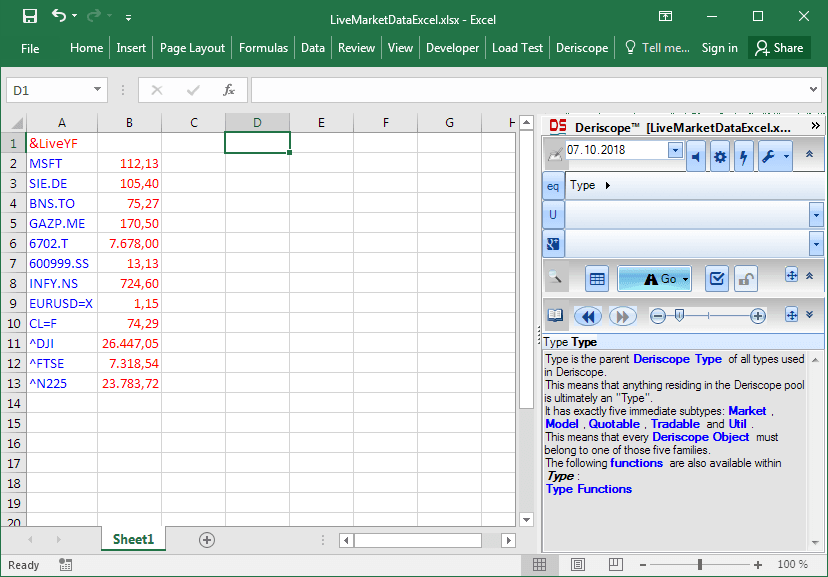
In the simplest possible variation, you would start by filling a column with the ticker symbols of the securities on which you want to receive live feeds.
For example, you may want to get feeds from Yahoo Finance on the following 12 tickers:
MSFT <- Microsoft (NASDAQ)
SIE.DE <- Siemens AG (XETRA)
BNS.TO <- Bank of Nova Scotia (Toronto)
GAZP.ME <- Gazprom (MCX)
6702.T <- Fujitsu (Tokyo)
600999.SS <- China Merchants Securities (Shanghai)
INFY.NS <- Infosys (NSE)
EURUSD=X <- Forex Rate EUR/USD
CL=F <- Light Sweet Crude Oil Futures (NYM)
^DJI <- Dow Jones Industrial Average Index
^FTSE <- FTSE 100 Index
^N225 <- Nikkei 225 Index (Osaka)
Then you could place these tickers in cells A2 to A13 and type the following simple formula on top of them in cell A1:
=dsLiveStartEngine("YF";5;A2:A13)
as shown below:
When this formula runs, the live feeds engine starts requesting feeds from Yahoo Finance (due to “YF” in the first argument) every 5 seconds (due to 5 in the second argument) for the 12 tickers specified in the range A2:A13 of the third argument.
You may change the provider “YF” in the first argument to any other provider that is currently supported by Deriscope, so that you are not dependent on any one of them. So if YF becomes inaccessible (as once happened in November 2017), you may simply change the first argument and your feeds will keep coming!
The feeds are received every 5 seconds and are kept in some internal memory buffer. You can easily display them anywhere you want in the spreadsheet by selecting a vertical range with a height of 12 cells and typing in the array formula {=dsLiveGetAsync("YF")}. Each time this formula is calculated, it returns the most recently received feeds.
The next image shows my spreadsheet with the array formula pasted to the immediate right of the column containing the tickers, so that the association between tickers and prices is obvious.
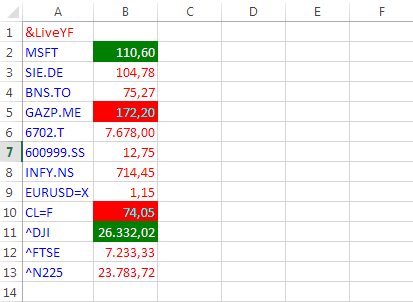
The array formula is declared volatile, which means it will be automatically recalculated when anything in the spreadsheet changes. But you can force its recalculation to occur as soon as feeds arrive by clicking on a special Auto Refresh button in the Deriscope wizard. In any case, when the displayed prices change, the respective cells will flash green if their price goes up and red if their price goes down. This is a typical display of my spreadsheet at the end of a 5 second cycle:
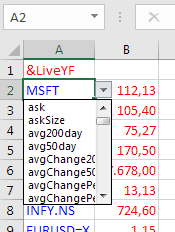
As I explained in the list of criteria, a good live feeds utility must be like a servant ready to address your more specialized needs. You may for example want to display other types of data, beyond last traded prices, such as previous close or percentage change. You may easily accomplish this task by adding a fourth argument inside the dsLiveStartEngine formula that references a row of fields entered anywhere in the spreadsheet.
At this point you would have no idea what the possible field names may be. You can view all valid field names by selecting any ticker-containing cell, for example cell A2 containing the ticker MSFT, and clicking on the appeared validation dropdown as per image below:
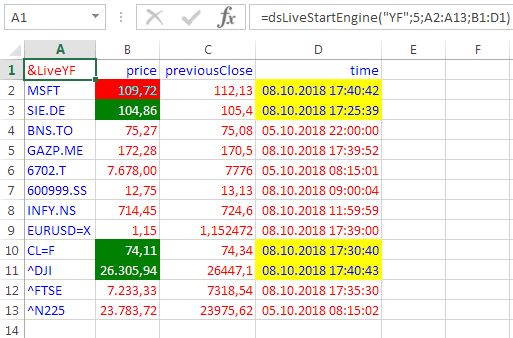
Rather than memorizing and typing the chosen fields in the top row, it is far easier to copy cell A2 and paste it in the cells where you want the fields to appear. For example, if you want to display the three fields price, previousClose and time, you could paste cell A2 in cells B1, C1 and D1 and then use the respective dropdowns to select the desired fields. Then you should add the range B1:D1 as the fourth argument inside the dsLiveStartEngine formula and extend the range on which the array formula applies to B2:D13 so that three columns of feeds are displayed:
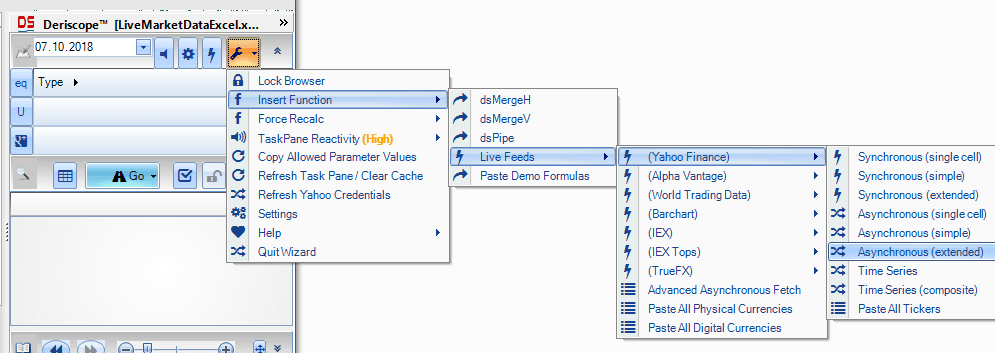
You do not need to memorize the various formulas or type them in by hand. Deriscope comes with an integrated wizard in the form of a taskpane that can be conveniently hidden to the right of the spreadsheet window. If not hidden, it looks like that:
It may look a bit imposing at first sight, perhaps because it is designed to deal primarily with derivatives pricing and portfolio management and only marginally with live feeds. But if you click on the button with the tools symbol, you can easily navigate to the final menu item Asynchronous (extended) that generates the exact same formulas discussed so far. In the following image you can also see the list of live feeds providers supported by Deriscope as of the time of writing:
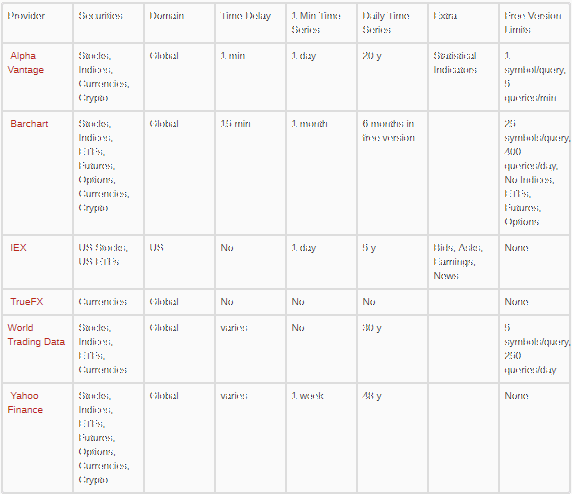
The strengths and weaknesses of these providers are summarized in the following table:
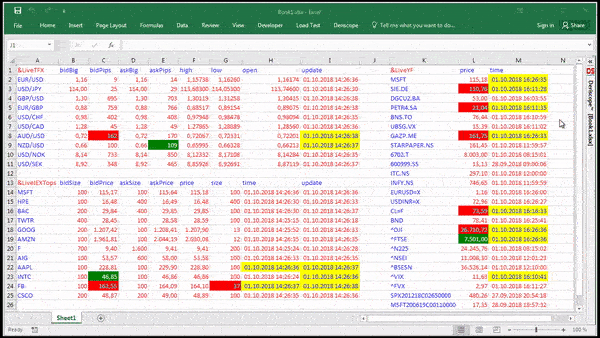
It is even possible to receive live feeds from several providers simultaneously. The video below is a continuous loop of a 10-second recording of my spreadsheet when three providers are employed, each with an update interval of 1 second.
Founder of deriscope.com, a site dedicated to the precise pricing and risk management of financial derivatives in Excel by means of the proprietary Deriscope wizard interface.
In the past, held senior quantitative, front and middle office roles in the trading floors of major banks in New York, London and Frankfurt, with the last position as global head of the Fixed Income and Credit Derivatives Phi team of UBS in London.


