
LISI investment letter for the fourth quarter of 2018, titled, “A Tale Of Two Perspectives.”

Q3 hedge fund letters, conference, scoops etc
- A chasm has formed in the US between two perspectives so far apart that reconciliation seems impossibly distant: is the end of the economic expansion near or not? Now approaching 2019, market observers fall into two camps: one that anticipates further growth by pointing to fiscal stimulus and an allegro drumbeat of positive economic indicators, and another that trumpets caution as it spies the darkening clouds of peak-of-market activity that have historically preceded a downturn
- After September's Fed rate hike, the US sovereign yield curve may finally be normalizing as the US Treasury 10-year Note reached a 3.2% yield after months of stagnating below 3.0% (we expect further Fed rate hikes in December and into 2019). Fears of imminent yield curve inversion that might signal coming recession would be alleviated by a yield curve that begins to morph toward its regular upward sloping shape. New heights reached by US stock indices provide a telling corollary to the rising bond yields with the Dow and S&P 500 reaching new records
- Issuers have taken advantage of low interest rates to refinance in recent years. Yet, a gradual tightening of refi standards by global banks and investors could eventually congeal into a sclerotic mass of resistance that leaves some highly leveraged companies exposed to threats of a liquidity crunch. A wave of defaults would likely ensue that, when coupled with waning investor confidence, could result in an economic downturn and falling equity markets. Still, despite higher interest rates, continued economic expansion may allow companies to generate sufficient cash to address their leverage directly as debt comes due
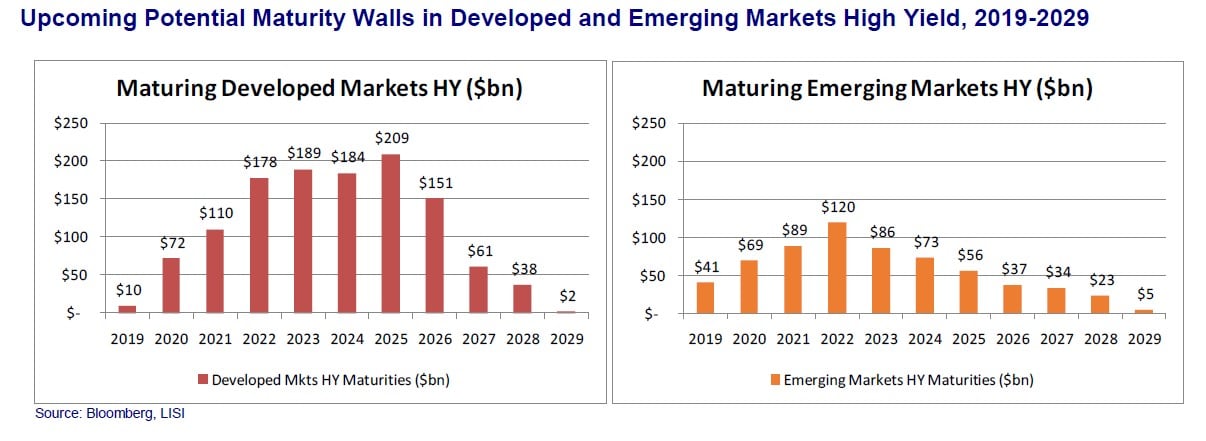
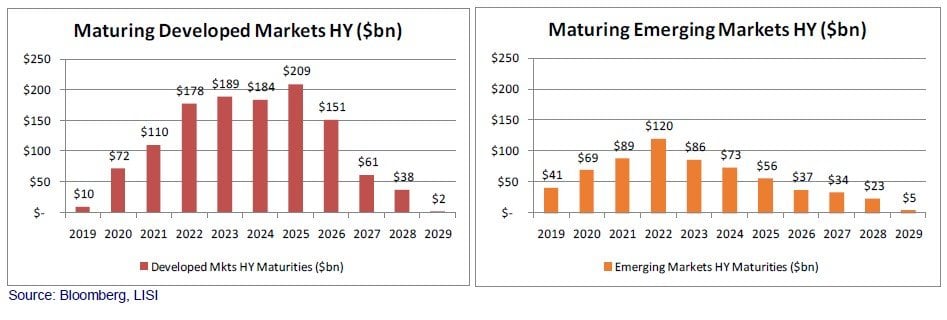
- High yield corporates show significant refinancing needs in coming years, potentially under adverse future financing conditions. While issuers have largely paid down 2019 maturities, the following years to 2023 reflect an aggregate repayment need of $550bn for developed market HY issuers and $360bn for their EM counterparts (see charts below)
- As fiscal stimulus has taken the baton from the multi-year support of extremely accommodative monetary policy, strong corporate performance leads the LISI Investment Committee to maintain an overweight equities stance in its Tactical Asset Allocations. We do remain vigilant of the potential for interest rate overshooting by the Fed and the possibility that some geopolitical event shocks investors’ enthusiasm. Further, we are watching the evolution of companies’ ability to refinance debt going into 2019 and beyond. While two differing perspectives on the coming path are valid, the prevailing winds appear to be guiding the dark clouds of a downturn away
LISI 4Q 2018 Investment Letter: A Tale Of Two Perspectives
A chasm has formed in the US between two perspectives so far apart that reconciliation seems impossibly distant: is the end of the economic expansion near or not? Now approaching 2019, market observers fall into two camps: one that anticipates further growth by pointing to fiscal stimulus and an allegro drumbeat of positive economic indicators, and another that trumpets caution as it spies the darkening clouds of peak-of-market activity that have historically preceded a downturn. Each can find statistics to support its view, from elevated levels of low-grade, covenant-light bond issuance on one side, to a 48-year low in US unemployment on the other. In our own deliberations, the LISI Investment Committee acknowledges no presence of a clear near-term antagonizing factor. With that, we maintain our overweight equities position geared toward US stocks, while reducing our emerging markets equity exposure and shortening the duration of our fixed income allocation. At the same time we remain vigilant of the potential for interest rate overshooting by the Fed and the possibility that some geopolitical event shocks investors’ enthusiasm. Further, we are watching the evolution of companies’ ability to refinance debt going into 2019 and beyond.
1. Debt Maturity Walls to Watch
Upcoming debt maturities can signal potential distress for highly leveraged corporate issuers, particularly those that face a coming “maturity wall” of principal payments under adverse future financing conditions. Globally, issuers have taken advantage of the low interest rate environment that has prevailed since the Great Recession. But a gradual tightening of refi standards by global banks and investors could eventually congeal into a sclerotic mass of resistance that leaves some highly leveraged companies exposed to threats of a liquidity crunch. A wave of defaults would likely ensue that, when coupled with waning investor confidence, could result in an economic downturn and falling equity markets.
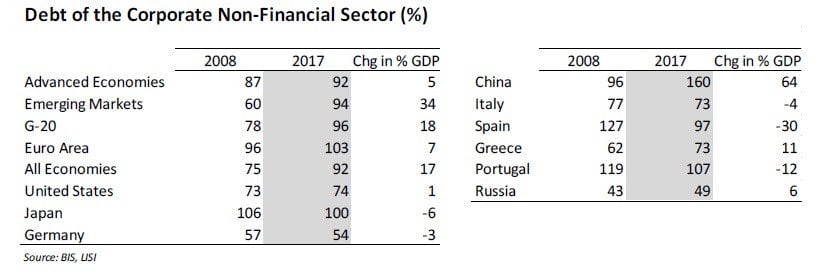
Since 2008, overall global corporate debt has expanded by roughly a fifth as a percent of GDP. Most countries have experienced modest GDP growth alongside development of their capital markets, yet a few outliers in the aggregates stand out. Chinese corporations, in particular, had debt outstanding in 2017 that was equivalent to 160% of GDP, up from 96% in 2008. The advanced economies, G-20 and emerging markets (EM) all average corporate debt of around 90%-100% of GDP, with the advanced economies historically at that level and emerging markets increasing from 60% as of 2008. The US and Germany stand out with lower leverage, at 74% and 54%, respectively as of 2017 (see table below), while corporate leverage in the European periphery countries has generally fallen, e.g., Italy, Spain and Portugal (note that Italy’s recent volatility stems from government debt and spending).
We find it instructive to lay out potential trouble spots were financing conditions to tighten in coming years. To this end, we map out high yield corporate maturities below for developed markets and for emerging markets issuers. These data, comprised of the bonds eligible for inclusion in Bloomberg Barclays indices, show significant refinancing needs. Notably, one sees that issuers have largely already refinanced or paid down 2019 maturities, with developed market issuers somewhat ahead of those in EM (see tables below). Still, over the following four years to 2023 the data reflect an aggregate repayment need of $550 billion for developed market high yield issuers and $360 billion for their EM counterparts.
Periodic waves of volatility can spark concern over maturity walls, yet the low interest rate background of recent years eased lending standards and made new financing readily available. Looking forward, despite a higher interest rate environment, it is entirely possible that continued economic expansion allows companies to generate sufficient cash to address their leverage directly as debt comes due.
2. Possible Curve Normalization in Fixed Income as the UST 10-yr Note Charges to a 3.2% Yield
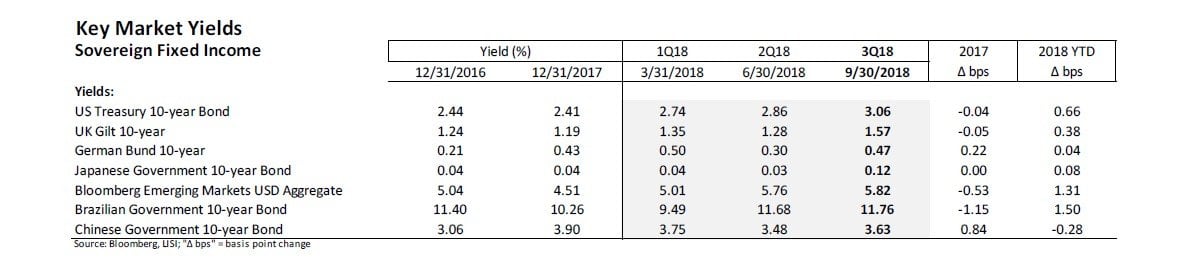
An incipient normalization of the US sovereign yield curve may finally be underway. As of early October, the fixed income market appeared to capitulate on resistance to higher yields on the US Treasury 10-year Note, sending its yield to 3.2% after months of stagnating below 3.0%. Reluctance to break through 3.0% occurred even as a steady flow of positive indicators signaled continued economic strength. With that barrier of resistance broken, a steepening of the yield curve may ensue, though it remains to be seen how the long end of the curve develops. Increasing yields in US sovereigns will likely push global investors to prefer US Treasury securities over other developed markets debt for which yields remain mired in low single digits (see chart below).
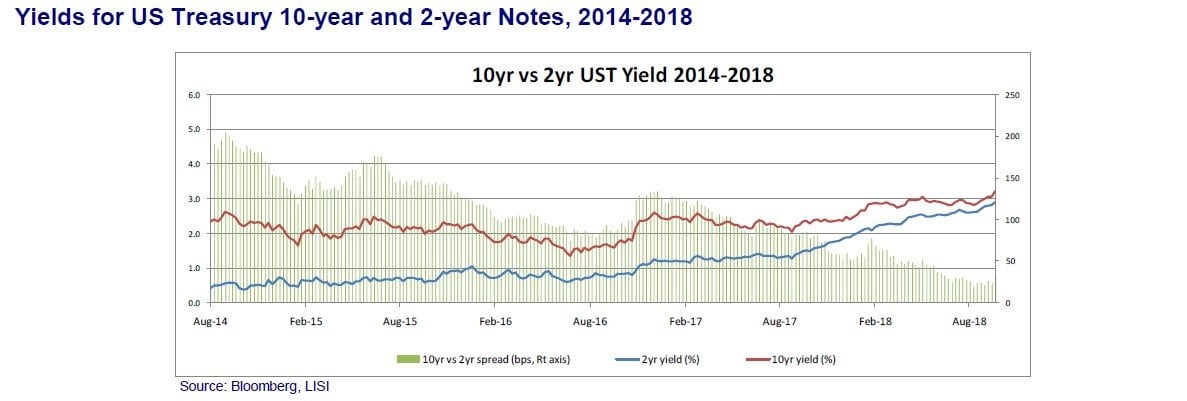
Fears of imminent yield curve inversion that might signal coming recession would be alleviated by a yield curve that begins to morph toward its regular upward sloping normality. The chart below still shows a tight relationship between US Treasury 10-year and 2-year Note yields, but the recent breakout in the longer term yield, if it holds, would steer these apart.
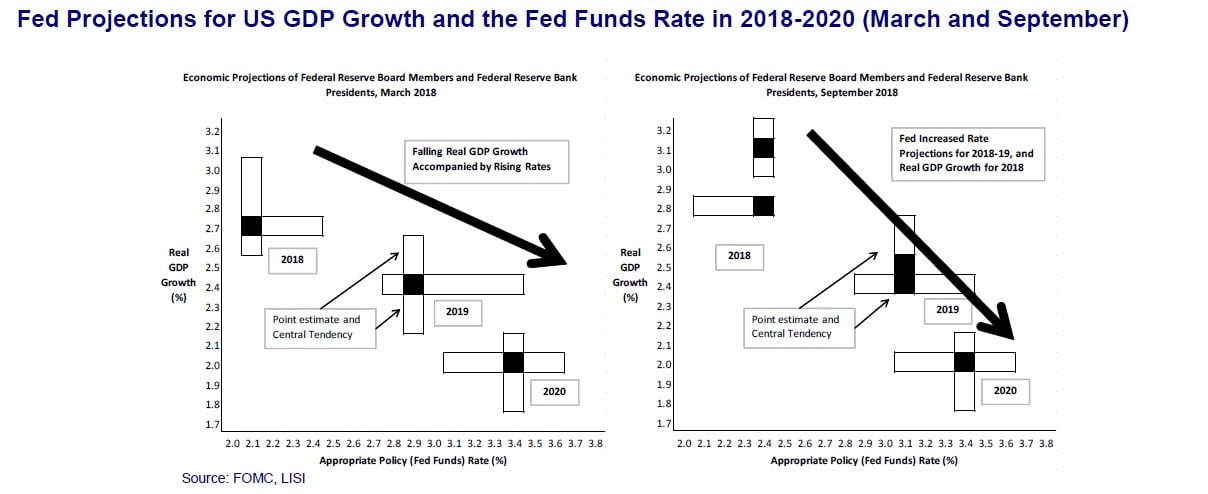
September's rate hike from the FOMC was widely expected, and Fed Funds futures now place the probability of a further 0.25% hike in December at about 74%. The outlook for 2019 is less predictable as futures display only a 23% probability that the Fed increases three times next year, as suggested by its "Dot-Plot" projection to end 2019 with a 3.00%-3.25% Fed Funds rate target rate (see charts below). The market appears split between one and two 0.25% hikes next year. Meanwhile, Fed survey respondents further increased their short-term growth projections in September as compared to March. They continue to project slowing economic growth by 2020.
3. Equities in the US Earning their Recent Record Levels
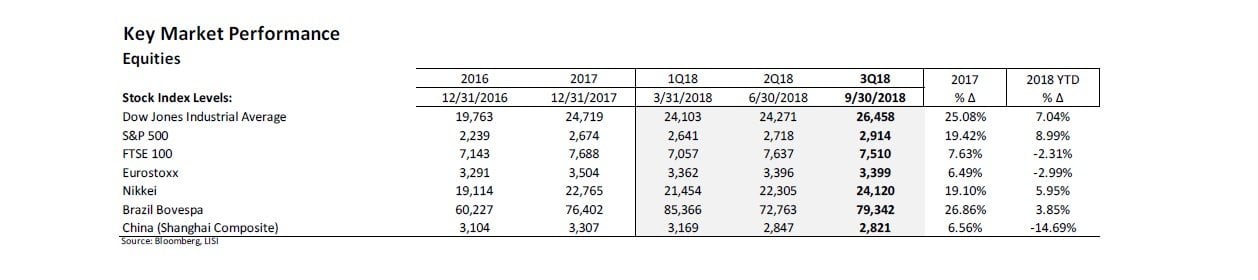
The new heights reached by US stock indices provide a telling corollary to the rising yields seen in fixed income. The Dow closed above 26,000 at the end of 3Q18, and has continued to rise since then. The S&P 500 has also hit new highs and is up over 9% YTD, after a very strong 2017 (see table below). European and Chinese stocks are negative on the year, reflecting slowing growth and, possibly, early effects of Brexit and other ongoing trade issues. The Nikkei is modestly higher.
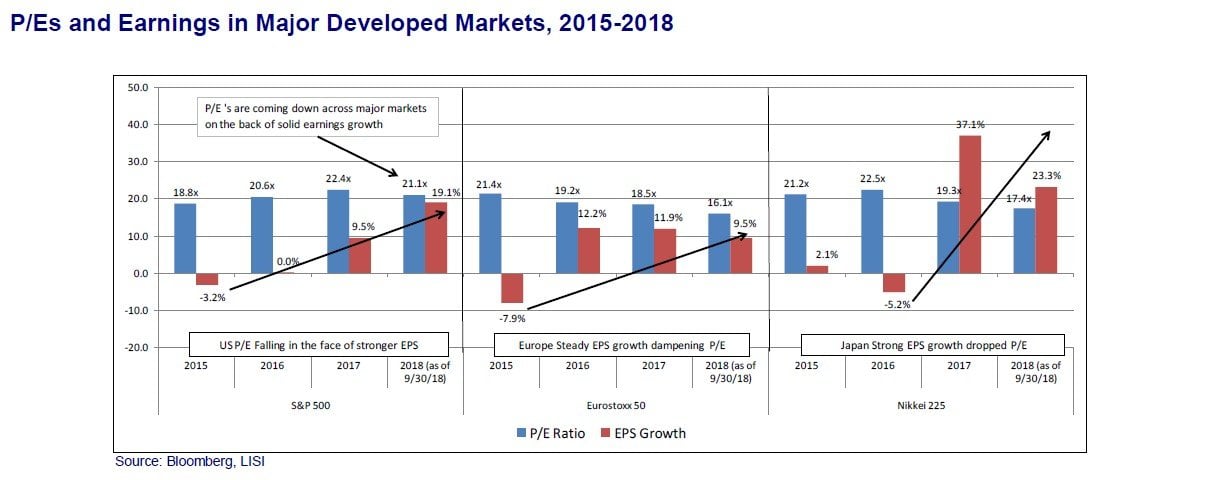
Steep equity price boosts often prompt caution based on valuations, but at least on a price-to-earnings (P/E) basis the trend does not alarm (see chart below). Rising YoY corporate earnings are outpacing prices so that, for instance, the S&P 500 ended the third quarter with a P/E ratio of 21.1x, compared to a 22.4x measure at the end of 2017.
Conclusion
In light of strong corporate performance and signs that both fiscal and monetary policy are reasonably supportive, the LISI Investment Committee at its late September meeting voted to maintain its current Tactical Asset Allocations, which reflect a positioning in equities overweight to the Committee's longer term Strategic Asset Allocations (Allocations by model are available upon request). Accordingly, across asset classes we favor the following:
- Fixed Income – We recommend shortening duration and accepting somewhat higher credit risk to mitigate effects of the anticipated rate hike cycle, while taking advantage of improving fundamentals
- Equities – We are positive on equities, particularly in the US, given improving EPS, support from US fiscal stimulus, and the Fed's slow and steady approach to hiking interest rates. We are cautious about the prospects for European equities and have shifted our stance somewhat toward the US and Asia
- Alternatives – We like the low correlation to core markets exhibited by alternative assets, and favor their inclusion as a small component of portfolios with moderate to higher risk profiles
- Cash – We recommend keeping a small allocation in cash to capitalize on any market dislocations
The current state of economic indicators in the US leaves little room for pessimism as fiscal stimulus has taken the baton from the multi-year support of extremely accommodative monetary policy. As such, we can look to signs of potential trouble to come, but cannot state with any conviction that we see these as highly probable threats. While two differing perspectives on the coming path are valid, the prevailing winds appear to be guiding the dark clouds of a downturn away.


