Excerpted from Stanphyl Capital’s August letter to investors, discussing their portfolio holdings and Russell 2000 PE TTM crash.
As noted in recent letters, through this entire bull market low interest rates were used to justify egregious earnings multiples on stocks, as well as creating those earnings via cheap mortgages, auto loans, debt-financed stock buybacks, etc., and yet now those rates are now climbing while the liquidity withdrawal of quantitative tightening continues. Even before the arrival of (or perhaps anticipating) massive deficit-related U.S. debt issuance starting later this year, the 10-year U.S. treasury yield has definitively broken its long-term downtrend and now sits at nearly 2.9% while the 2-year yield of over 2.6% handily bests the S&P 500’s approximately 1.8%, thereby presenting an attractive alternative to an index priced at nearly 25x trailing GAAP earnings when a flattening 2-10 curve and recent slowing in global growth and ongoing trade wars may be indicative of a looming economic slowdown…

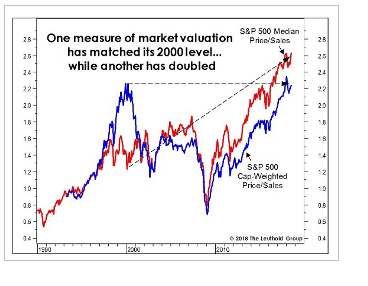
…while a pick-up in inflation means rates will continue to rise and profit margins will compress. Yes, Q2 earnings came in very strong, but nearly all of that was derived from a significantly lower corporate tax rate and share-count reductions via buybacks, neither of which are a formula for sustainable earnings growth. Stocks should soon begin pricing in 2019 earnings and compared to 2018—unlike 2018 vs 2017—they won’t be advantaged by year-over-year tax cuts, making for much tougher comps. Additionally, the percentage of U.S. household wealth allocated to stocks is the second-highest ever—topped only at the height of the internet bubble. Thus, I continue to believe that the catalysts are here for the high-multiple stock party to end, and if you doubt that for the broad market this is a bubble rivaling that of 2000, perhaps this S&P 500 price-to-sales chart will convince you:
Russell 2000 PE TTM Is At 59
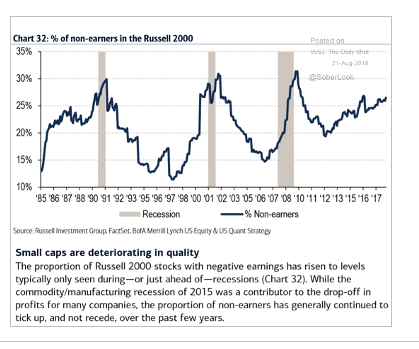
Although the fund has no position in the S&P 500, we remain short the small-cap Russell 2000 (via IWM), which—despite this year’s tax cuts and fiscal stimulus—still has a trailing GAAP PE of 59. Here are some interesting Russell 2000 charts, first focusing on its percentage of money-losing companies.
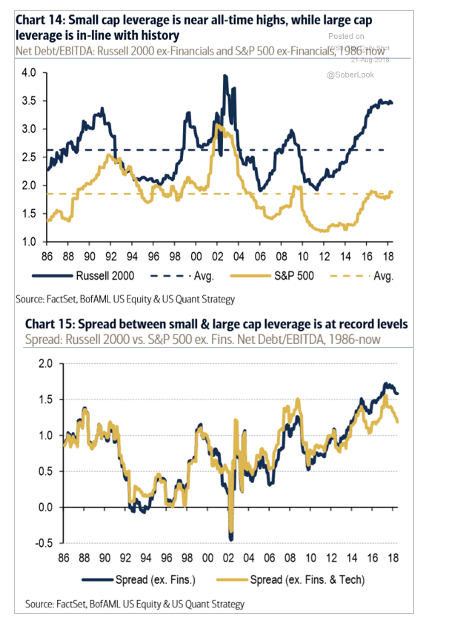
…next looking at those companies’ massive amount of leverage…
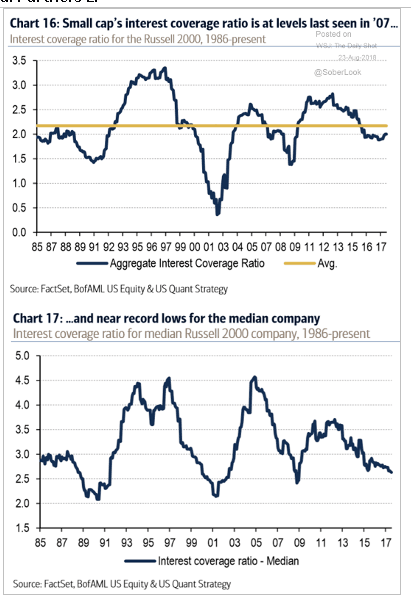
…and finally looking at their scary-looking interest coverage ratio…
I’d far prefer to be buying microcap companies than shorting them but I’m a deep-value guy and in this environment I’m just not seeing much deep (or even shallow) value out there. When it returns we’ll be the guys with the lowball bids that are suddenly getting filled.
We continue (since late 2012) to hold a short position in the Japanese yen via the Proshares UltraShort Yen ETF (ticker: YCS) as Japan continues to print 7% of its monetary base per year after nearly quadrupling that base since early 2013. In fact, of the world’s three largest central banks (the Fed, ECB and BOJ), the BOJ is now the only one not on a path to tightening. One result of this insane policy (in 2018 the BOJ has bought 75% of JGB issuance!) is there are days when no 10-year JGBs trade in the cash market! The BOJ’s balance sheet is now larger than the entire Japanese economy-- it owns over 45% of all government debt and over 75% (!) of the country’s ETFs by market value, and in July the BOJ reiterated that this policy will continue indefinitely (albeit with some minor tweaks).
Just the interest on Japan’s debt consumes 9.2% of its 2018 budget despite the fact that it pays a blended rate of less than 1%. What happens when Japan gets the 2% inflation it’s looking for and those rates average, say, 3%? Interest on the debt alone would consume over 27% of the budget and Japan would have to default! But on the way to that 3% rate the BOJ will try to cap those rates by printing increasingly larger amounts of money to buy more of that debt, thereby sending the yen into its death spiral.
When we first entered this position USD/JPY was around 79; it’s currently in the 111s and long-term I think it’s headed a lot higher—ultimately back to the 250s of the 1980s or perhaps even the 300s of the ‘70s before a default and reset occur.
We continue to hold a short position in the Vanguard Total International Bond ETF (ticker: BNDX), comprised of dollar-hedged non-US investment grade debt (over 80% government) with a ridiculously low “SEC yield” of 0.95% at an average effective maturity of 9.3 years. As I’ve written since putting on this position in July 2016, I believe this ETF is a great way to short what may be the biggest asset bubble in history, as with Eurozone inflation now printing 2% annually these are long-term bonds with significantly negative real yields. In June the ECB announced that in Q4 it will reduce its monthly bond buying program from €30 billion/month to €15 billion/month, and then will eliminate it completely at year-end, thereby removing the biggest source of support for those bonds’ bubble prices. Currently the net borrow cost for BNDX provides us with a positive rebate of over 1.3% a year (more than covering the yield we pay out) and as I see around 5% potential downside to this position (vs. our basis, plus the cost of carry) vs. at least 30% (unlevered) upside, I think it’s a terrific place to sit and wait for the inevitable denouement.


