A new map of Antarctica shows the cold, lonely continent in incredible detail. Many would say it’s not the most beautiful place to visit, but the new detailed map in high-resolution can help us learn more about how this icy, snow-covered continent covered looks.
Scientists at Ohio State University and the University of Minnesota are behind this creation, and they claim it is the most detailed map of Antarctica ever created. They also say their new map makes it the best-mapped continent on our planet.
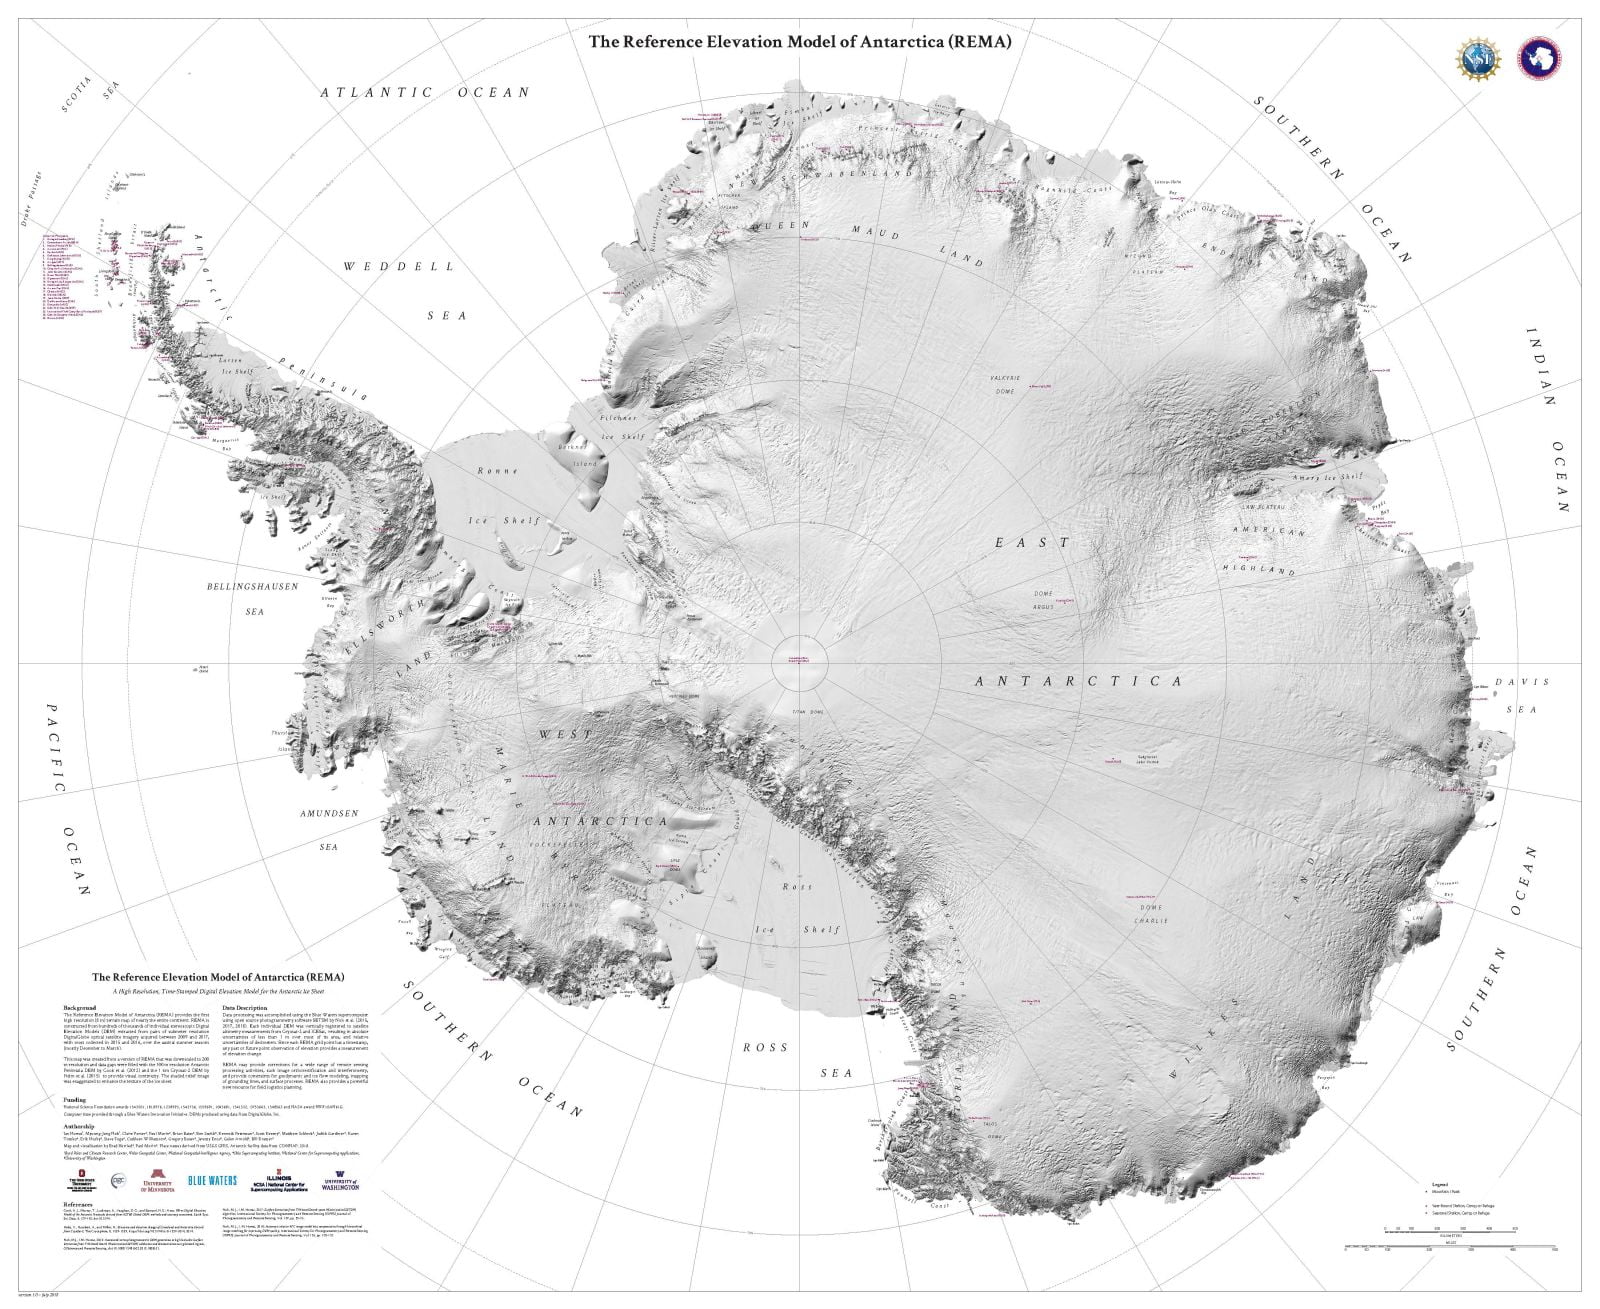
To construct the new map of Antarctica, also known as the Reference Elevation Model of Antarctica (REMA), scientists used hundreds of thousands of satellite images. The images were taken between 2009 and 2017, according to Gizmodo’s Earther. The team constructed a supercomputer to analyze the massive amounts of data from these images, and that analysis led to the creation of the new map of Antarctica. Interestingly, the computer also analyzed how the land has changed over time. As a result, REMA is an incredibly detailed topographical map with a hefty file size of over 150 terabytes.
The map has a resolution of two to eight meters, as opposed to the standard 1,000 meters, according to a press release from Ohio State. The New York Times adds that the detail on this new map of Antarctica is so accurate that it it’s like being able to see down all the way down to cars on a road or even smaller things, as opposed to only being able to see objects the size of Central Park. The scientists who created the map say its error margin is just a few feet.
“Up until now, we’ve had a better map of Mars than we’ve had of Antarctica,” Ohio State University glaciologist Ian Howat, head of the REMA project, said in a press release. “At this resolution, you can see almost everything. We can actually see variations in the snow in some places. We will be able to measure changes in the surface of the continent over time.”
The team will use the new map of Antarctica in future research projects for data on things like snow cover, ice motion, thinning glaciers, and potential river and volcano activity. More importantly, scientists will be able to track the impacts of climate change on the continent and more easily plan expeditions to the continent.
None of that would be possible without highly efficient supercomputers and software capable of automating the assembly of overlapping images from satellites. The software they wrote helped them create this highly accurate map. Ian Howat and M.J. Noh of the Byrd Center developed the software which analyzed the data.
“We had to start from scratch to build this. The software had to filter the data, process it, and turn it into a refined product for the scientific and broader community to use,” Howat said.