Today – Apple became the first public company worth over $1 trillion dollars. . .

Q2 hedge fund letters, conference, scoops etc
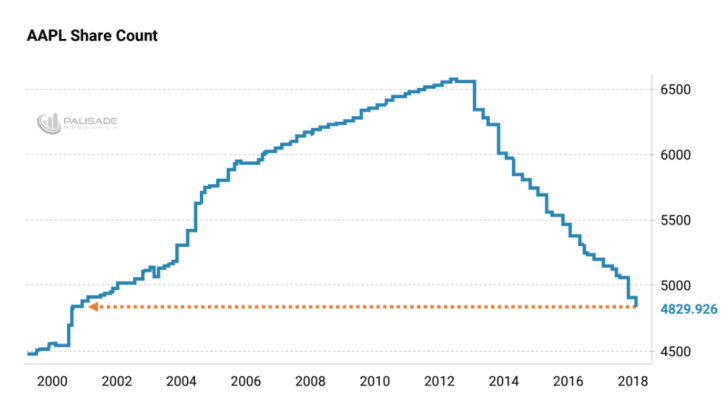
Thanks to very low interest rates – the company’s piling on debt and buying their own shares back – shrinking the float.
And because of a worldwide rush into mutual funds and exchange traded funds (ETF’s) – there’s crazy demand for Apple shares.
The king of ‘buy and hold’ investing and a Champion of equities – Warren Buffet – must have grin on his face from ear to ear. Because Apple’s surge just netted him a huge profit for his company – Berkshire Hathaway – of over $2.6 billion.
Many now may be thinking that they should buy Apple and other such stocks – right?
Well, not exactly.
Because according to this favorite Buffet metric – the market looks extremely overvalued and the future looks scary. . .
The Market Cap to GDP metric is a long-term value indicator. And it’s become popular recently thanks to Warren Buffet.
During an interview in 2001 with Fortune – he claimed that this indicator is “probably the best single measure of where valuations stand at any given moment.”
And what his favorite indicator’s showing us today is that stocks are more over-valued than they’ve ever been. . .
So – what is the Market Cap to GDP – aka the ‘Buffet Indicator’?
It’s easy. Just calculate the total market value of all stocks outstanding and divide it by the nations GDP.
When the ratio is greater than 100% – it means that stocks are considered overvalued and have historically less upside going forward.
And when the ratio is less than 100% – it means the opposite. That stocks are considered undervalued and historically have more upside.
I look at it this way: when the ‘Buffet Indicator” is more than 100%, the stock market is negatively asymmetric (high risk, low reward). And when it’s less than 100%, the stock market is positively asymmetric (low risk, high reward).
Or simply put – buy when it’s under 100% and sell/avoid when it’s over 100%.
Now that we know this – what’s the good ole’ Buffet Indicator looking like today?
It’s telling us to avoid stocks as they’re the most expensive they’ve ever been. . .
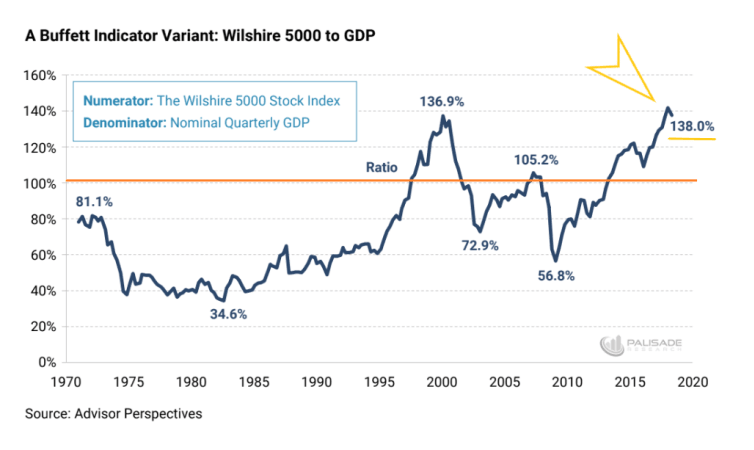
It’s almost at 140% – the highest on record.
Higher than both the 1990’s Dot-Com bubble and the 2007 Housing bubble. . .
Does this mean stocks will crash tomorrow? Probably not (it’s anybody’s guess when). But we’ve seen the ‘smart money’ already bailing out of equities.
Lately there’s been extreme volatility in the FAANG-tech stocks. Companies like Netflix, Facebook, and Twitter suffered huge losses last week.
“Over a two-day period at the end of last week, when the world’s largest social network suffered the largest single-day drop of any company in history, this collection of stocks — Facebook, Apple, Amazon.com, Netflix and Google (part of Alphabet Inc.) — lost $185 billion in value.” – wrote BizJournal
What we do know is that historically – when the Buffet Indicator gets this high – it means we’re in some-kind-of bubble and there’s huge downside ahead.
And when the downside does come – it’s sudden and swift. Just look at the chart above – sharp drops after each peak. . .
Even though Buffet preaches buying into the stock market – what he’s actually doing is sitting on more than $100 billion in cash.
“Having said that, it does seem like Buffett himself is paying attention and agrees that the market is generally expensive. After all, the lack of attractive investment opportunities has resulted in Berkshire Hathaway accumulating nearly $110 billion of cash and equivalents on its balance sheet. Plus, Buffett has specifically cited valuation when discussing the absence of major acquisitions lately.”
He knows that markets today are ‘frothy’ and overvalued.
The very damn ‘Buffet Indicator’ that’s named after him even says it.
And I’ve also written about this risky market – many times – that you can read here and here and even here. . .
Most importantly – It’s not in Buffet’s portfolio’s best-interest for the crowd to realize all this. Because as we learned from George Soros’ Theory of Reflexivity – market perceptions can drive reality and shift short-term fundamentals.
Otherwise put – if investors believe the market’s heading for a crash, they’ll sell their stock and sit on cash. Doing this will cause equities to tank and the dollar to soar. This will cause liquidity to dry up, an under-performing market, and deflationary spiral.
Soon the fears cause a self-fulfilling prophecy. . .
Today – with the economy’s outlook looking shaky at best. And an overvalued market – things look ripe for a big market sell off.
So remember a couple of things:
- Beware what Buffet or the Elite saycompared to what they do. . .
- The Buffet Indicator –although not great at timing– is historically accurate. . .
- You won’t get hurt if you simply buy low and sell/avoid when things are high. . .
Apple hitting $1 trillion market cap looks good – superficially. But debt fueled share buybacks, and easy money policies that have driven markets higher over the last decade are coming to an end as central banks worldwide tighten.
And as the chart above shows – the last two times over-valued markets and over-indebted economies suffered central bank tightening – things got very ugly.
Article by Adem Tumerkan, Editor-in-Chief, Palisade-Research


