Broyhill Asset Management letter for the half year ended June 30, 2018. As we take a step back to examine the first half of the year, we review recent performance and investment activity, discuss the intricacies of beekeeping, consider the lifespan of the average grandma, and contemplate the value in boredom relative to the allurement of excitement.

Q2 hedge fund letters, conference, scoops etc
For the first six months of 2018, Broyhill generated low single-digit returns with significantly less volatility than global equity markets. While our results may not be the most exciting in the industry (which we think is a good thing), we are pleased with our performance in an increasingly challenging market. Detailed quarterly reports, including account and benchmark performance, portfolio holdings, and transaction history, have been posted to our investor portal.
Technical analysts, who rely solely on price movements rather than fundamentals to evaluate securities, live by the mantra: “The trend is your friend.” Lucky for them, the trend in asset prices has been up and to the right for the past decade. And during the first six months of the year, everything seemed peachy, as long-standing trends continued without a hitch: the technology sector outpaced the pack, stocks outperformed bonds, domestic outperformed international, and growth outperformed value. But these returns mask a recent transition occurring in the market: since bond yields peaked in May, the market’s return to all-time highs has been led by defensives at the expense of cyclicals. Technicians may now be better served by recalling another popular mantra: “Right on the trend, wrong at both ends.”
As we take a step back to examine the first half of the year, we’ll review recent performance and investment activity, discuss the intricacies of beekeeping, consider the lifespan of the average grandma, and contemplate the value in boredom relative to the allurement of excitement.
“If the hive be disturbed by rash and stupid hands, instead of honey, it will yield us bees.” — Ralph Waldo Emerson
In last year’s annual letter, we cautioned investors not to confuse quiet monthly statements with a lack of ideas or an absence of enthusiasm. Nine years into one of the longest bull markets in history, euphoria and complacency had replaced caution and prudence. The fear of missing out is, for most investors, too strong to overcome. A lack of patience and an urge to "do something" forces most investors to disturb the hive with “rash and stupid hands.” Yet they are always surprised when they get stung.
When is the best time to harvest honey from the hive? It’s a question that crosses the mind of every beekeeper and investor. The answer—in beekeeping and in investing—is “it depends.” There are many factors that affect the decision of when to harvest honey from hives. To begin, one must be patient. Bees must be given adequate time to collect nectar and process it into honey. Rush the process and harvest before it is fully ripened, and you end up with fermented honey. The other extreme is to wait until all the flowers have finished blooming. By harvesting as late in the season as possible, beekeepers maximize the honey crop. But wait too long, and bees may not have honey left over to prepare for the coming winter. Since you can’t predict the weather, prudent beekeepers harvest what they can when the weather is good and leave enough honey in the hive to survive the cold season dearth.
Investing, like beekeeping, requires patience. It is impossible to know with certainty when to sit on your hands and when to harvest ideas. Decisions must be made with less than perfect information. Ideas must be given adequate time to develop and mature. Rush the process and put capital to work too quickly, and you forgo the option to buy later at lower prices. The other extreme is to wait for prices so low that bargains are available everywhere. But wait too long, and you risk missing out on some decent crops along the way. You also risk not having any investors left at the end of the season. Since predicting stock market cycles is as reliable as predicting the weather, prudent investors will harvest what they can when the weather is good, leaving enough dry powder in the portfolio to survive another season.
The research process itself produces no honey. The honey comes later—sometimes much later. But just as a successful beekeeper cannot succeed without a high-quality hive, successful investing will not succeed without ongoing high-quality research.
More often than not, there is no immediate buying opportunity. This was the case for much of last year. But last season’s research prepared us for this season’s opportunity. In the first six months of the year, we harvested several ideas from our beehive.
Despite rich valuations across global equity indices, many good businesses fell toward their lowest valuations ever. Our ongoing research put us in a position to quickly identify the undervaluation and execute across the portfolio. Below are a few highlights from this year’s swarm of activity. We’ve been busy bees!
INVESTMENT REVIEW
As markets rallied to all-time highs in January, we continued legging into index hedges, which we began buying in Q4-17. While we expect most of our put options to expire worthless (and size our positions accordingly), we got some help when markets cratered in February. We monetized SPY and QQQ hedges and initiated new positions in McKesson (MCK), Cameco (CCJ), and Allergan (AGN), as stock prices and valuations approached new lows. Market volatility continued in March, providing us with an opportunity to sell rich put options on Allergan, AmerisourceBergen (ABC), and Dicks Sporting Goods (DICKS). We also increased our investment in Oaktree Capital Group (OAK) and trimmed core positions in eBay (EBAY) and Cognizant Technology (CTSH) at near all-time highs.1
At the start of the second quarter, we established two new positions in Walgreens Boots Alliance (WBA) and Facebook (FB) as both stocks traded near 52-week lows. We increased our position in Time Warner (TWX) as the stock drifted lower on deal uncertainty in May. We also added to our investment in Dollar General (DG) as investors overreacted to the company’s first quarter earnings report. We continued buying MCK, AGN, and TWX during the month of June, and established new positions in ABC and CVS, post Amazon’s acquisition of PillPack at month end. As markets rebounded during the second quarter, we closed out profitable positions in Chipotle (CMG) and TripAdvisor (TRIP) and exited our position in TWX after the deal closed. Prior to quarter end, we had crystalized gains in all our short option positions initiated earlier in the year.
Our biggest winners in the first half were Syntel (SYNT), Facebook (FB), and Cameco (CCJ). Investments in Dollar Tree (DLTR), Walgreens Boots Alliance (WBA), and McKesson (MCK) were the largest detractors from performance. Shares of DLTR, WBA, and MCK fell 21%, 16%, and 14%, respectively, through the first six months of the year. While earnings estimates for all three companies have increased throughout the year, their multiples have fallen by nearly a third. We have added significantly to each and discuss our thesis for “defensive” investing in more detail below.
SYNTEL
Syntel, an Indian IT Services company, gained 40% in the first half of this year. We made our initial investment in SYNT at $20, following sharp revenue declines at the company that caused the stock price to collapse from a high of $50. This reversal in fortune was driven primarily by cost cuts at Syntel’s largest customer and a shift in U.S. political sentiment around foreign work visas. We continued buying shares down to $16 as the stock drifted lower through the first half of 2017.
Our investment hypothesis was simple. While the market extrapolated the company’s troubles into perpetuity and valued SYNT like a melting ice cube, we believed that the challenges were temporary and addressable. The company had enjoyed decades of organic, double-digit growth, led by its founder and majority shareholder, and we believed that long-term historical performance was more likely the norm than the exception. As we expected, the business stabilized, and investors gradually drove the stock price up to a more suitable, higher multiple. Our investment in SYNT gained 40% in the first half of the year, then jumped an additional 25% in July as the business was acquired for $41 per share.
CAMECO
Cameco is one of the largest and lowest-cost producers of uranium in the world. For most traditional value investors, who focus on long-term returns on capital, commodity businesses like CCJ are ugly ducklings. Fortunately, for us, few investors take a supply-side view of the capital cycle. Two entities control more than half of the world’s uranium supply. Demand is inelastic as security of supply is more important than price for utilities purchasing long-term contracts. Since it can take up to ten years to bring new supply onto the market, uranium cycles can be drawn out and extreme. After peaking at $136 per pound in 2007, uranium prices bottomed in the $40 - $50 range, before rallying toward $70 in 2011, when Japan’s Fukushima disaster ushered in the current bear market in prices. Japan shuttered 54 reactors, and Germany followed suit, right when secondary supply was spiking.
We watched from the sidelines as uranium prices fell to a low of $16 in 2016, waiting for the capital cycle to turn down. During this period, profits collapsed, management teams were changed, capital expenditures were slashed, and the industry consolidated. The Global X Uranium ETF (URA) lost 90% of its value from its peak in 2011. Any analysts left covering the shrinking uranium sector today are too gun-shy to see that collapsing investment and contracting supply have paved the way for recovery. Analysts with highly specific knowledge are prone to adopt the inside view. Generalists can adopt the outside view and understand that mean version—and investment returns—are driven by changes on the supply side, which is far more certain than forecasting demand. We began buying shares of CCJ around $9 after both Kazakhstan and Cameco, the world’s largest producers of uranium, announced significant supply cuts in November and December 2017. CCJ closed the quarter north of $11 per share.
Subsequent to quarter-end, we increased our position in CCJ after management announced that it would shut down operations at Key Lake and McArthur River for “an undetermined period.” The mines are not expected to be back on line until long-term supply contracts have been signed on acceptable terms. We think “acceptable terms” to Cameco implies uranium prices about double today’s spot price.2
Shares of Facebook lost a quarter of their value earlier this year, falling from $195 in February to $149 in March, when news broke that Cambridge Analytica had retained information on millions of users without their consent. We initiated a position in stock and options in April as momentum investors lost their momentum and Zuckerberg appeared to lose his mojo in front of Congress. Our work on Equifax, following its own cybersecurity crisis, enabled us to act quickly and decisively. As shares rallied to close the quarter near all-time highs at $195, we monetized our options.3
After quarter-end, Facebook set another record: a disappointing earnings report cost the company over $100 billion in market capitalization, prompting the biggest single-day loss in U.S. history. While most investors would be thrilled if a “normal” portfolio company posted 44% operating margins on 42% revenue growth, FB is no “normal company.” Rather, it is likely one of the best businesses we have ever owned, yet still trades at quite a “normal” multiple of earnings.
While the downside in the stock was more about future guidance than current earnings, we believe Facebook has a far deeper moat than investors realize, and the sustainability of its business should continue to create significant value. While our Equifax playbook enabled us to recognize the opportunity quickly, our previous investments in Google and Apple, two other situations when sentiment soured and growth slowed, might provide a better analogy for FB today. Because we believe near-term investments at FB will serve to widen the company’s long-term moat and the reduced guidance was well within our range of expectations, we increased our position following the second quarter earnings report.
In addition to the equity activity noted above, we added to our basket of closed-end funds (CEFs) in every month of the first half through May, as yields increased and discounts widened. While equity CEFs remain expensive, the median fixed income CEF is trading near a double-digit discount to NAV today, a level only exceeded by a fraction of observations over the past quarter century. Today’s fixed income discounts are even wider in the tax-exempt sector, where municipal CEFs have only been cheaper 5% of the time. With the Fed hiking the short end of the curve, the move in long-term rates appears to have stalled. If economic activity rolls over, bond yields should follow. We are positioned accordingly, with our highest allocation to tax exempt CEFs at their widest discounts in history. Now we wait.
Our bees must be given adequate time to collect nectar and process it into honey. The size of our next big harvest will be determined when the value we discovered is eventually recognized by the market. The harvest is one of the most enjoyable parts of keeping bees. It is also one of the most rewarding aspects of investing. It is the culmination of all the hard work that has come before. When given enough time, it can go smoothly and efficiently while setting up the colony up for success in the following season.
INVESTMENT STRATEGY
At Broyhill, we try to stay out of the forecasting game. This doesn’t mean we don’t have hunches, but it does mean that we don’t make investment decisions that are dependent upon those views proving correct. Fortunately, economic forecasting is not a necessary requirement for investment success. We don’t need to know where we are going. Just knowing where we’ve been is enough.
WHERE WE’VE BEEN
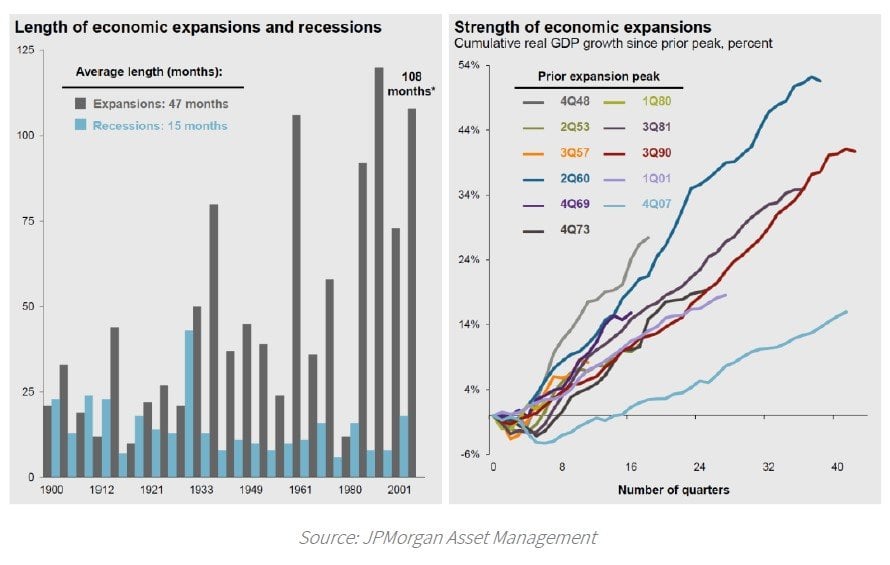
Economic cycles don’t just die of old age. But they are called “cycles” for a reason. They have a beginning and an end. Otherwise, they’d be called something else entirely. So, it’s worth noting that this is the second longest cycle on record. By this time next year, it will be the oldest expansion ever.
The average age of an expansion is about four years. For perspective, the average person’s life expectancy is about 70 years. So one human year is about 18 “economic years”—which means that if this expansion was your grandmother, she’d be about 162 years old today.
The longer the lifespan, the more susceptible grandmas and economic expansions become to major shocks to the system – say, cancer or a global trade war.
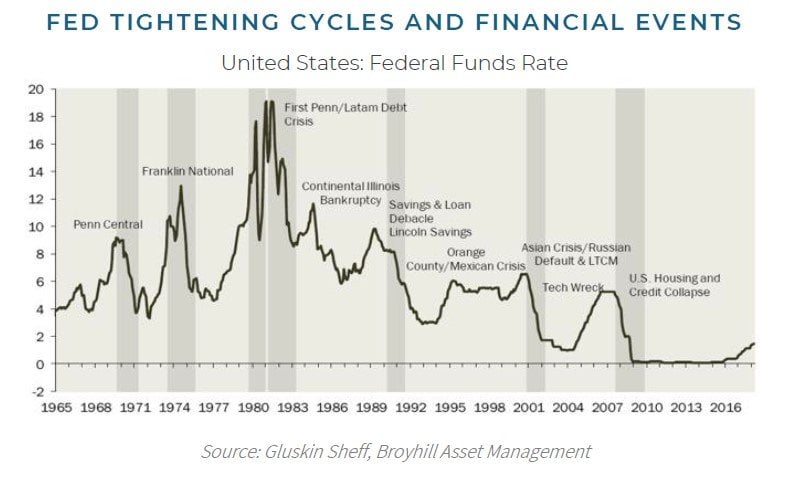
For Americans, the leading cause of death is heart disease; for economic cycles, it is Fed policy. Even the healthiest expansions are eventually murdered by the Fed.
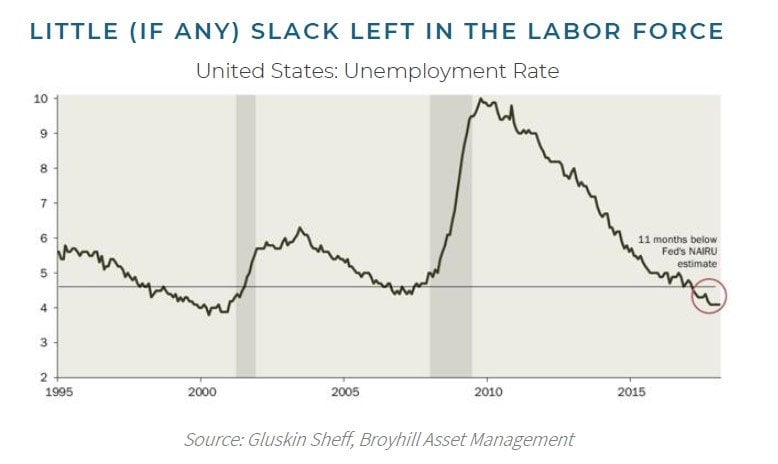
The unemployment rate is another useful indication of where we are in the cycle. Full employment is typically lauded as a sign that the economy is firing on all cylinders. But this is looking in the rearview mirror. Historically, unemployment has been very low just before economic peaks. Stocks generally struggle when employment has fallen to 4% or lower.
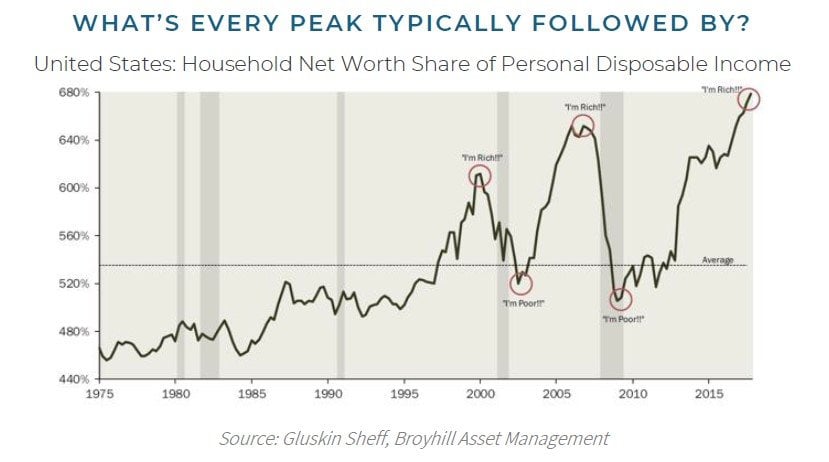
After one of the longest expansions on record, household net worth as a percentage of income is at record highs. As a consequence, it should not be surprising that consumer sentiment has followed suit. We are now in the top decile of all readings on the Consumer Confidence Index. While this is a great indicator of where we’ve been, it’s not so good for where we are going.
Historically, the stock market has peaked about the same time as consumer confidence, and recession has followed several months later.
Can animal spirits carry the economy and asset prices higher? Sure. But at this point in the cycle, that’s not a smart bet, at least according to the data. Of course, we don’t know when the next recession will begin. But we do know that the stock market almost always tops before it does. And the worst bear markets have historically coincided with recession. The average decline during those bear markets has been 45% from peak to trough.
LATE-CYCLE BEHAVIOR
While the market is still trading near all-time highs, gains have become increasingly concentrated in the largest, most expensive stocks, increasingly pushed higher by passive, momentum-driven buyers. This is typical late-cycle behavior.
Ten years of easy money has left the consensus comfortably numb. After shunning stocks and hoarding cash at the bottom of the cycle, the consensus now believes that the greatest risk comes not from holding stocks, but from not holding enough of them.
Passive investing and momentum investing are the primary manifestations of this belief. During the later stages of a bull market, they are one and the same. Artificially high demand for a small group of stocks benefits speculators in the bubble they help create.
The “Nifty Fifty” captivated investors during the 1960s. These 50 “one-decision” stocks, identified by Morgan Guaranty Trust, represented the fastest-growing companies in the world. By 1972, when the S&P 500 Index's P/E stood at a then-lofty 19, the Nifty Fifty's average P/E was more than twice that, at 42. Among the most inflated were Polaroid, McDonald’s, Disney, and Avon with P/E’s of 91, 86, 82, and 65. respectively. Then, as a Forbes columnist described it, the Nifty Fifty "were taken out and shot one by one." Xerox, Avon, and Polaroid fell 71%, 86%, and 91% from their respective highs.
In the early 2000s, a combination of optimism and passive investing led to a gross misallocation of capital, which facilitated the TMT bubble. A direct consequence of these distortions was a growing obsession with tracking error, which led to an absolute disaster for passive investors. In the twelve months after March 2000, the “least risky” and most widely owned stocks collapsed relative to the market. The ten largest companies underperformed the market by nearly 25%. The tech-heavy NASDAQ went on to lose nearly 80% of its value over the next three years.
The most recent cycle was dominated by housing and bank stocks. AIG shares, which traded at a splitadjusted $1222 in 2007, trade at $53 today, up 10x from a low of $5 in 2009. Shares of Citigroup, now trading around $70, are up 7x from their $10 low a decade ago, but are still down 90% since 2007. The bubble in housing coincided with a bubble in China and in commodities. After a successful debut on the Shanghai Stock Exchange in November 2017, PetroChina was the first company to ever reach $1 trillion in market value. Ten years later, the state-owned energy producer lost about $800 billion of market value. It trades for less than $200 billion today.
Last week, Apple became the first U.S. company to reach a market value of $1 trillion. Like the nifty fifty, the "FAANG" stocks—Facebook, Apple, Amazon, Netflix, Google parent Alphabet, and Microsoft—are great businesses that are dominating the competition. No surprise that they have also dominated the performance of the markets for the past decade. At their peak, the Nifty Fifty also drove the majority of the gains in the stock market. They then proceeded to lose more than half their value in the ensuing bear markets.
WHERE WE’RE GOING
What the herd buys differs from cycle to cycle. The common thread is that the herd buys the most popular stocks and drives up their value beyond rational justification. The herd buys what is in favor. And it sells what is out of favor—often driving prices far lower than reason.
The herd is often right—at least for a period of time.
And this herd has had a hell of a ride. But it appears that the most crowded trade of the past decade may now be reversing. If momentum’s decade-long leadership is ending, value investors stand to rake in phenomenal profits at the expense of the herd, who will be selling the most widely owned names in the market.
As capital flees momentum-driven names with little to no current earnings power, the herd will eventually pause long enough to ask: “Where should we put our money now?” At that point, we expect the market will come to recognize the value hiding in plain sight—boring, defensive businesses that are generating mountains of consistent cash flow. That’s where we are positioned today, because that’s where we are going.
Defensive sectors are now at an all-time low as a percent of total market capitalization. They have never been so out of favor.
The relative strength of defensive sectors has reached levels not seen since March 2000 and within spitting distance of the all-time low reached in November 1980.
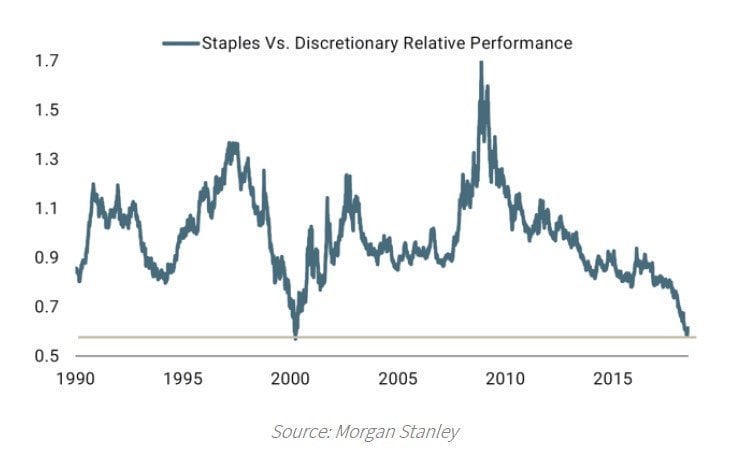
Accelerating economic growth and strong corporate earnings have driven markets back toward all-time highs, but since bond yields peaked, defensive sectors have been the market’s best performers. With relative performance, market capitalization, and valuations near all-time lows, we think the upside in high-quality, defensive businesses remains in front of us.
The setup from here has never looked better. Not only can we own a collection of high-quality, noncyclical businesses as we approach the top of the cycle, but we can own them today near their cheapest valuations in history.
A low purchase price relative to value limits downside risk. A flattening yield curve further limits the downside in defensive sectors, which have historically outperformed the market when the curve has fallen below 100 bps—a late cycle indicator. Once we hit that point, the yield curve has rarely topped 100 bps until we are in recession.
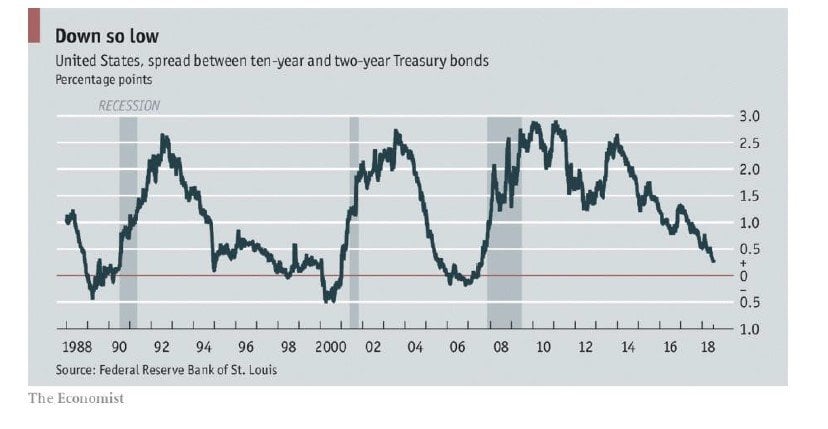
We can’t predict when the herd will come to its senses. But we do know that this cycle is extremely long in the tooth and that bear markets typically begin well before a recession becomes obvious.
If market momentum continues, we will probably fail to keep up—though we should still earn a reasonable return on our capital. We are perfectly comfortable with this scenario, and our investors should be too. More importantly, if the cycle turns and the market falls along with it, we expect that our relative performance will surge—and that we will still make a reasonable return on our capital.
We rarely see “perfect” in markets, but today is the best opportunity we’ve seen in a while to buy good businesses at great prices. An overlooked lesson of earlier cycles is that you didn’t have to wait for the market to bottom to make money buying cheap stocks.
Waiting for the “perfect” entry point often results in being late—because perfect is only obvious in retrospect.
During the last tech bust, boring, old, stodgy businesses were left for dead. Many great businesses were available at extremely cheap prices simply because there wasn't a good reason to own them. There wasn't a sexy story to sell, so no one was interested. As a result, those brave enough to buy cheap, unloved stocks made the most money during the market decline. While the market cratered, the cheapest names in the market appreciated in value.
We see a very similar situation today. Good businesses are trading far too cheap. Our largest holdings are trading at close to their lowest valuations ever. In contrast with the broader market, which is trading at historical highs, our investments are trading at historical lows.
In the short term, perception is sometimes more important than reality. So, we must look past short-term fluctuations and think independently about long-term business value. Our investment in McKesson, the largest equity position in our portfolio today, is an excellent example of this dynamic. As the stock has declined from a high north of $240 to recent lows around $125, investors have assumed the market must be correct, so they have continued selling. While it’s not always clear what expectations are embedded in today’s price, the market doesn’t always get it right.
In the past five years, MCK has generated $17 billion in free cash flow. Today, the company has a market capitalization of $25 billion. Assuming zero growth in free cash flow over the next five years, the business will generate cumulative free cash flow nearly equal to its total market capitalization. Although headlines remind us daily of growing threats to the business, the actual probability of this business dramatically changing in the next five years is much lower than the perceived probability. We are simply betting that the future might not be as bad as the price suggests"
Stock prices fluctuate as underlying fundamentals change or are perceived to change. Since business operations don’t fluctuate nearly as much as shares or as perceptions, prices often change not because reality has changed, but because our perception of reality has changed.
A big gap between perception and reality can create a big opportunity for profit.
We believe this is the case with our investment in Walgreens (WBA). Over the past five years, the business has doubled the amount of free cash flow it generates. Underlying fundamentals have not deteriorated, yet investors are suddenly paying a lot less for every dollar of earnings. The stock’s multiple has fallen from a high of 25x to a recent low of 10x—a valuation lower today than at the depths of the financial crisis. Despite continued headline risk and growing competition from the likes of Amazon, WBA will likely generate ~ $6 per share in earnings this year and has a clear path toward $8 per share in the next few years, as more scripts are sold through each store, regardless of the ebb and flow of the economy. With our downside limited by a low purchase price, we think the upside is significant. If investor sentiment shifts and begins to favor defensive earnings streams, our investment in WBA would double from recent lows, assuming it just traded back to a market multiple.
BOTTOM LINE
Morgan Housel, perhaps one of the best financial writers in modern time, recently published an article on “The Psychology of Money.” One idea in particular strongly resonated with us: “Good investing isn't necessarily about earning the highest returns. It's about earning pretty good returns that you can stick with for a long period of time. That's when compounding runs wild.” 5
This simple statement is perhaps the most overlooked and underappreciated fact in all of finance.
“Pretty good returns” are just not exciting. And investors crave excitement, even if they won’t admit it. They place more weight on unlikely outcomes than they should. Just as gamblers are willing to throw away money on lottery tickets for a small chance to win, investors are seduced by the excitement offered by speculative, high risk stocks.
Most investment managers are happy to oblige and provide their clients exactly with what they want. As it turns out, there is a perfectly rational explanation for these managers’ behavior, which ties back to the nature of incentives. Simply put, a more volatile portfolio increases the expected value of a manager’s compensation. And that big paycheck comes with an added benefit: owning volatile stocks makes it easier for investment managers to explain changes in the portfolio, “justifying” higher turnover along with higher commissions for their Wall Street friends.6
All this excitement comes at a cost. Even the most spectacular gains can be wiped out by a single, large loss, destroying years of investment success and eliminating the benefits gained by compounding. Consider that a conservative investor who compounds at 8% per year for a decade will end up with more money than an aggressive investor who compounds at 15% for nine years and then loses half in year ten. The aggressive investor, outperforming in the first nine years, will surely capture more media attention and more success as measured by assets under management. This may explain why most institutional investors are not interested in conservatism, but it is also the source of our current opportunity.
Evolution has hardwired investors to buy sexy and sell humdrum. Possibility generates enthusiasm, eagerness, and anticipation, which investors pay up for. As a result, many of our peers find it hard to resist the temptations of hugging the benchmark, following the herd, or going for a little excitement even if it’s “just for a second, just to see how it feels.”
Near-certain outcomes, on the other hand, are regularly undervalued by investors. Certainty engenders boredom and requires endurance and persistence. These traits are not particularly common amongst traders anxious to disturb the hive.
What beekeeping lacks in sex appeal, it makes up for in patience. You are unlikely to see a beekeeper on Squawk Box talking about the latest trends in this season’s honey harvest anytime soon. It’s about showing up and having the discipline to wait. It’s boring.
People often confuse maximizing returns with minimizing boredom. Investing doesn’t work that way. Opportunity hides where others don’t look.
People stay away from boredom, for fear of being bored. But at the right price, boredom is as exciting as it gets. The big, boring, defensive businesses that comprise the bulk of our portfolio are far from "sexy." But there's a lot to get excited about here.


