Please see below a fact-sheet containing statistics on activist investments from January to July 2018 (click on the image itself for a clearer view).

Q2 hedge fund letters, conference, scoops etc
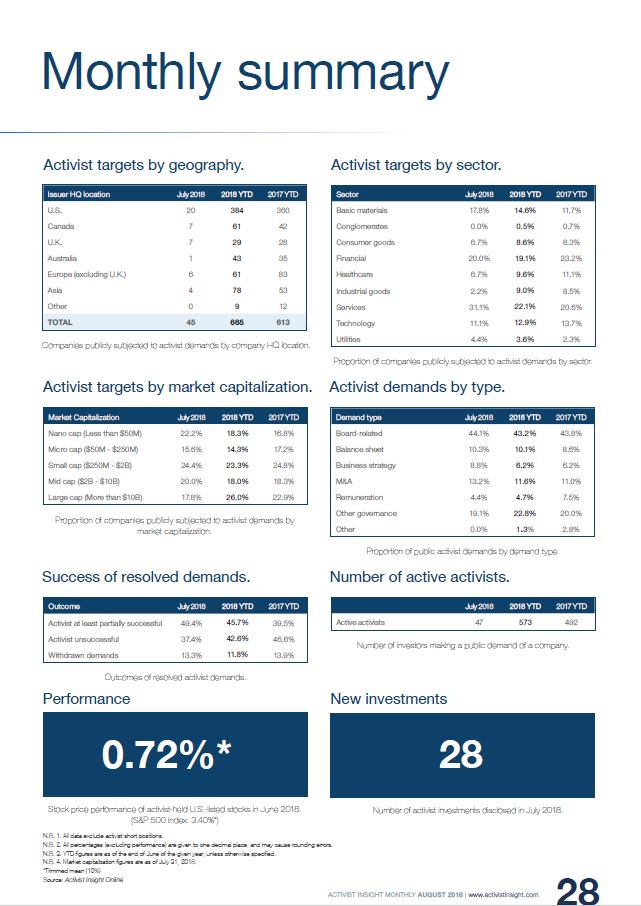
The below data points are global in nature unless otherwise specified.
- The U.S. was the only market with the number of companies publicly subjected to activist demands in double digits in July (20), with the U.K. and Canada in joint second at seven companies each.
- The biggest relative increase in activist demands by market capitalization so far this year is in large-cap companies (over $10 billion), when compared to the same period last year.
- Activist demands at industrial companies were sharply below year-to-date levels during July, while trending above the year-to-date average in services.
For any questions about the data, or if you have a follow-up request, please contact Josh Black at [email protected]. Please note that bespoke data requests may take 24-48 hours depending on the amount of manual work required.
Kind regards,
Josh Black
Since 2012, Activist Insight (www.activistinsight.com) has provided its diverse range of clients with the most comprehensive information on activist investing worldwide. Regularly quoted in the financial press, Activist Insight is the trusted source for data in this evolving space. Activist Insight offers five industry-leading products: Activist Insight Online, Activist Insight Shorts, Activist Insight Governance, Activist Insight Vulnerability – a tool for identifying potential activist targets – and Activist Insight Monthly – the world's only magazine dedicated to activist investing.


