
Key highlights for June 2018:

Q2 hedge fund letters, conference, scoops etc
- Hedge funds were down 0.34% in June with 1H 2018 returns barely hanging in the green with a flat 0.08% gain year-to-date. This would be the weakest first half performance of hedge funds on record since 2000. To contextualise, the strongest gain occurred in 1H 2009 when hedge funds gained 10.62% while the next weakest 1H performance came in 1H 2010 when managers posted gains of 0.91%.
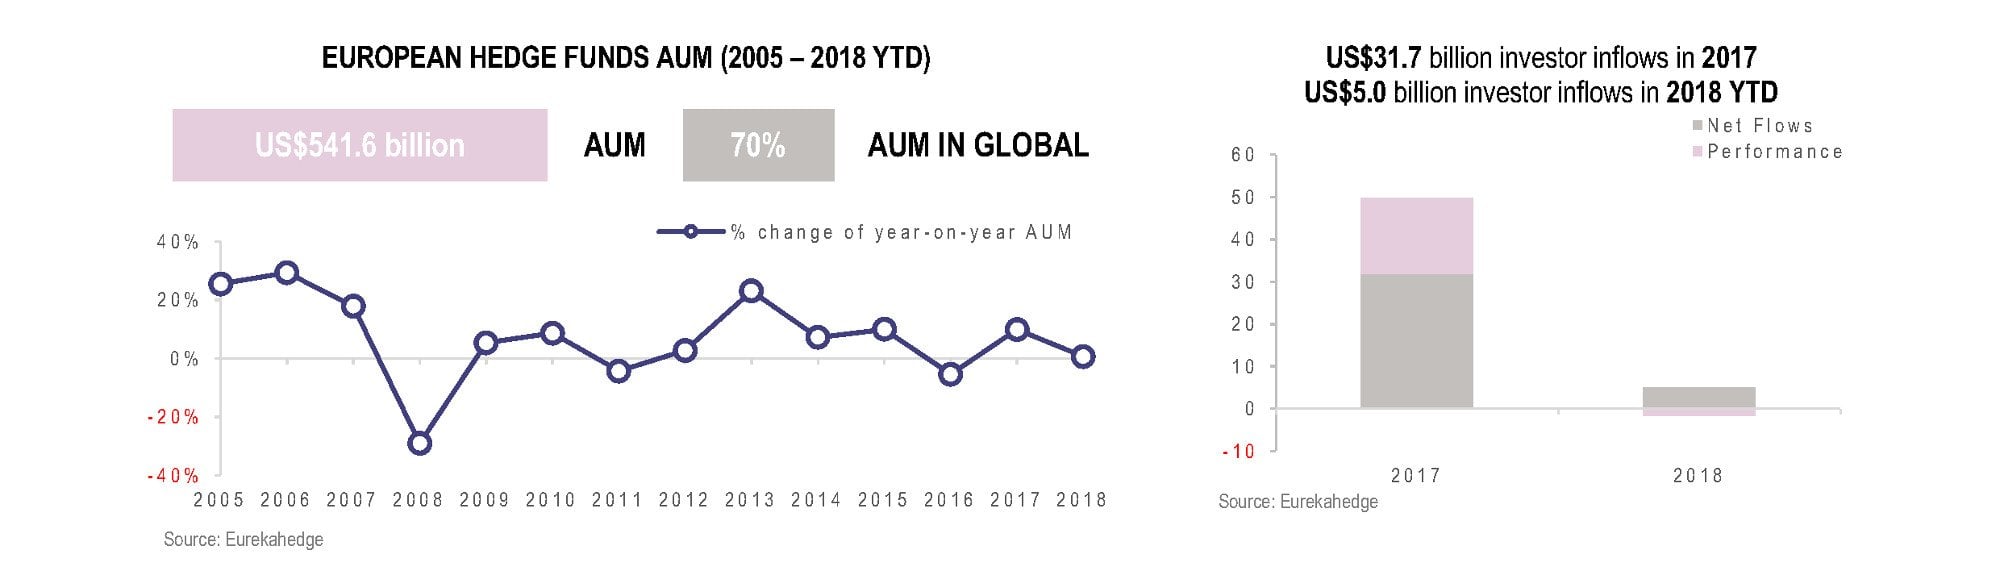
- Total hedge fund assets grew by US$8.8 billion over the past six months, which compares with a growth in total AUM of US$98.5 billion over the same period last year.
- Rising US-China trade war tensions and a strengthening US dollar have spelled trouble for Asian hedge fund managers in 1H 2018. Greater China focused mandates are down 0.44%, though outperforming the Shanghai and Shenzhen composites by well over 10%. Korea mandated hedge funds are down 4.21% over the same period, ahead of the Kospi Index which is down 5.73%. Meanwhile India mandated hedge funds have struggled with losses of 5.26%, underperforming the BSE Sensex Index by 9.27% in the first half of 2018.
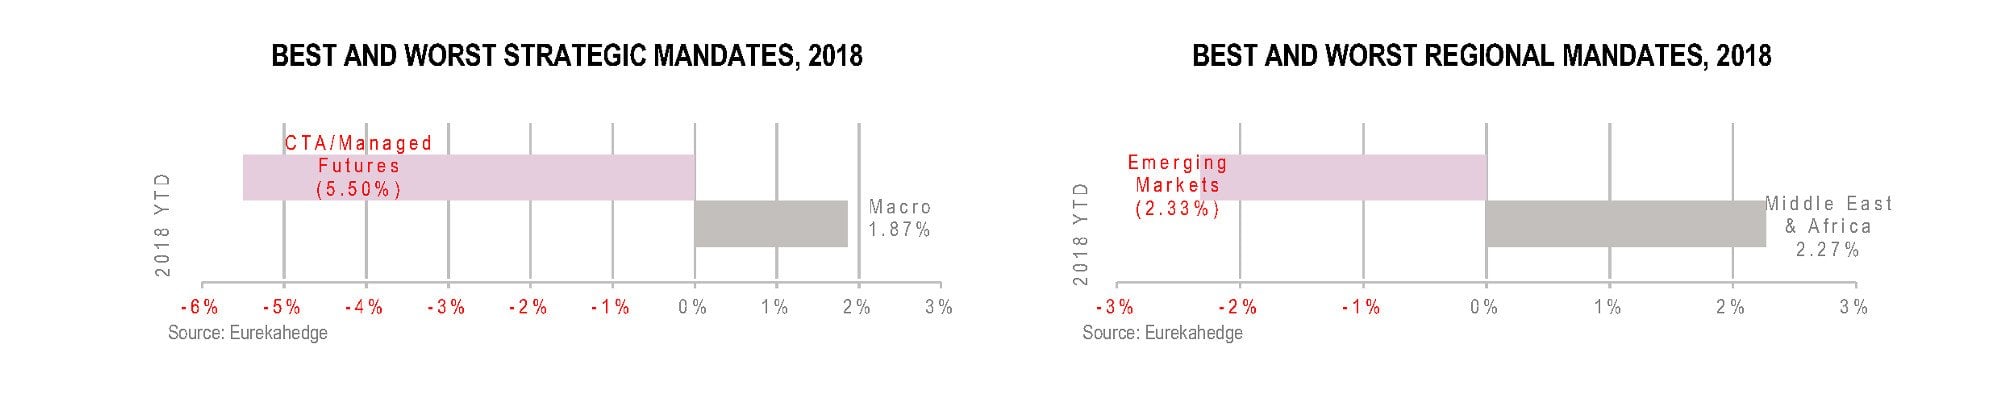
- Assets under management for CTAs have shrunk by 9.81% in 2018 as underlying managers posted their fifth consecutive month of investor redemptions with net outflows totaling US$7.1 billion.
- Event driven hedge funds remain the bright spot across all strategic mandates in 1H 2018, posting performance based gains of US$3.3 billion and attracting net investor inflows of US$4.4 billion. The Eurekahedge Event Driven Hedge Fund Index is up 2.59% year-to-date with underlying Asian event driven managers up 8.26% for the year.
- Across regional mandates, European hedge funds have posted a small decline in assets under management to the tune of US$5.9 billion. North American hedge funds have had the strongest showing for this year seeing AUM grow by US$11.9 billion. Meanwhile emerging markets focused hedge funds have seen their assets decline by US$6.8 billion.
- Asian hedge funds continue their struggle in 1H 2018 with losses of 0.61%, though outperforming underlying markets as the MSCI AC Asia Pacific Index (Local) posted losses of 3.47%. Japan mandated hedge funds are down 2.70% in 1H 2018, ahead of the 4.77% loss posted by underlying markets as captured by the Tokyo Topix Index.
2018 Key Trends in European Hedge Funds


The Eurekahedge Hedge Fund Index slumped 0.34% during the month of June, as managers struggled under the volatile market situation driven by the escalating US-China tariff spat over the month. The transitory ceasefire in the trade war was effectively ended when the White House announced a 25% tariff on US$50 billion of Chinese exports on June 15, which prompted China to respond in kind. Roughly 46% of the hedge fund managers tracked by Eurekahedge managed to outperform the underlying global equity markets as represented by the MSCI AC World Index (Local) which declined 0.21% over the month. The Eurekahedge Hedge Fund Index wrapped the first half of 2018 with a positive yet unremarkable return of 0.08% after spending three months in the red, a far cry from the 3.36% gain posted by the index over the first half of 2017.
European and North American fund managers led the pack over the month as they barely slid into negative territory with 0.08% and 0.09% losses respectively. Despite the political uncertainties revolving around Italian government formation and Brexit deals, European equity markets proved to be more resilient compared to Asian and Latin American equity markets. Something similar could be said about North American equity markets, as the S&P 500 index edged 0.48% higher during the month despite the trade friction between the world's two largest economies. On the other hand, Asia ex-Japan fund managers posted losses of 1.84% in June, dragged down by the poor performance of Chinese and Korean equity markets which were hit particularly hard by the tariffs announced by the Trump administration.
May 2018 and June 2018 returns across regions
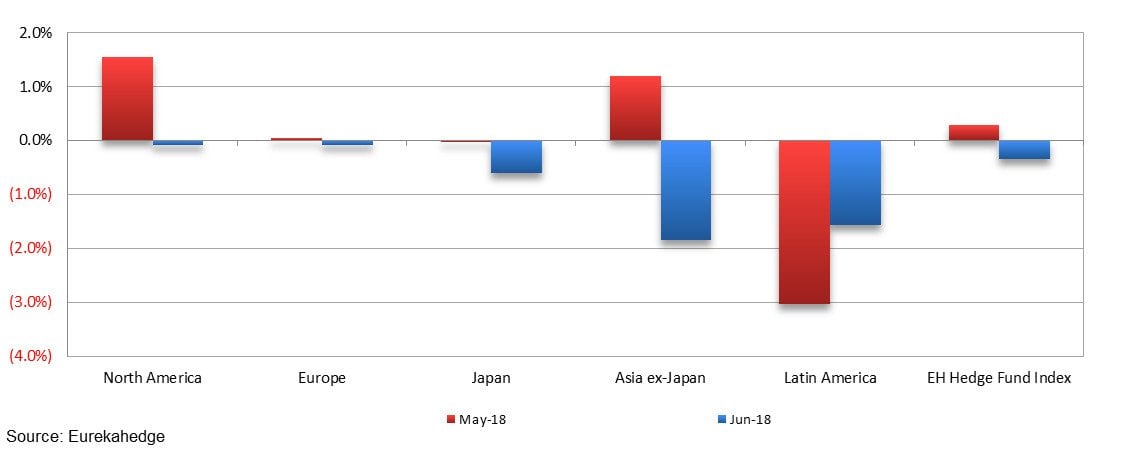
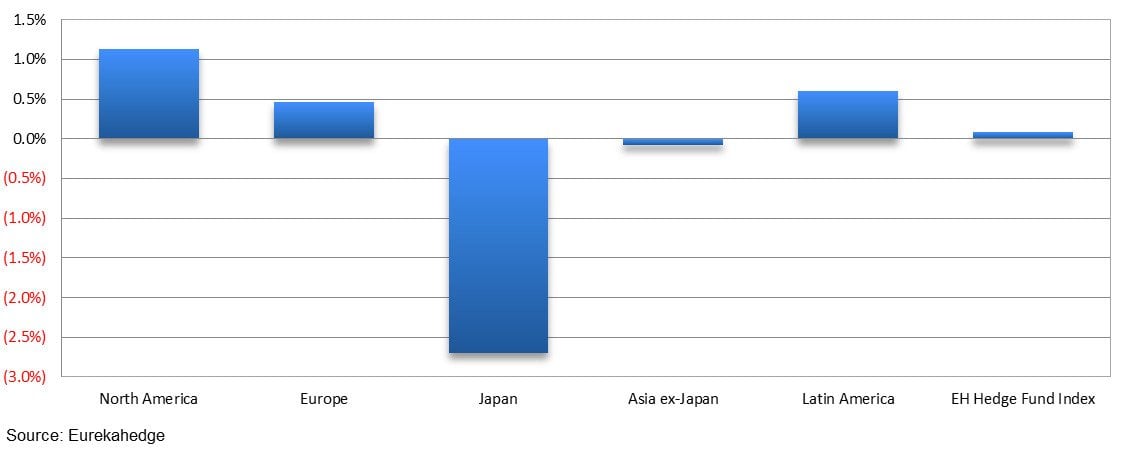
On a year-to-date basis, North American fund managers were up 1.13%, outperforming their peers from other regions. The losses suffered by Latin American fund managers during the month brought them down to second place with a gain of 0.60% over the first half of the year. Meanwhile, the Eurekahedge Japan Hedge Fund Index which tracks hedge fund managers investing exclusively in Japan was down 2.70% as of June 2018 year-to-date, after suffering five consecutive months of losses. Geopolitical tension related to North Korea and trade friction risks between the US and China weighed on the performance of Japanese hedge fund managers.
2018 year-to-date returns across regions
Mizuho-Eurekahedge Asset Weighted Index
The asset weighted Mizuho-Eurekahedge Index ended June down 0.19%, pushing their 2018 year-to-date return down to -1.40%. It should also be noted that the Mizuho-Eurekahedge Index is US dollar denominated, and during months of strong US dollar gains, the index results include the currency conversion loss for funds that are denominated in other currencies. The US Dollar Index gained 0.52% in May as the greenback strengthened against many major currencies.
Performance was lacklustre across the board among the suite of Mizuho-Eurekahedge Indices with the Mizuho-Eurekahedge Asia Pacific Index and Mizuho-Eurekahedge Emerging Market Index posting the gravest losses of 3.00% and 2.21% respectively, followed by the Mizuho-Eurekahedge Long Short Equities Index which slid 1.23% over the month. On a year-to-date basis, all indices are in the red, with emerging markets focused fund managers posting the sharpest decline as they ended the first half of 2018 down 6.30%.
| Mizuho-Eurekahedge Indices June 2018 returns
|
Mizuho-Eurekahedge Indices 2018 year-to-date returns
|

CBOE Eurekahedge Volatility Indexes
The CBOE Eurekahedge Volatility Indexes comprise four equally-weighted volatility indices – long volatility, short volatility, relative value and tail risk. The CBOE Eurekahedge Long Volatility Index is designed to track the performance of underlying hedge fund managers who take a net long view on implied volatility with a goal of positive absolute return. In contrast, the CBOE Eurekahedge Short Volatility Index tracks the performance of underlying hedge fund managers who take a net short view on implied volatility with a goal of positive absolute return. This strategy often involves the selling of options to take advantage of the discrepancies in current implied volatility versus expectations of subsequent implied or realised volatility. The CBOE Eurekahedge Relative Value Volatility Index on the other hand measures the performance of underlying hedge fund managers that trade relative value or opportunistic volatility strategies. Managers utilising this strategy can pursue long, short or neutral views on volatility with a goal of positive absolute return. Meanwhile, the CBOE Eurekahedge Tail Risk Index tracks the performance of underlying hedge fund managers that specifically seek to achieve capital appreciation during periods of extreme market stress.
The CBOE Eurekahedge Relative Value Volatility Hedge Fund Index returned 0.24% in June, outperforming the three other indices in this suite, as they all posted losses over the month. Preliminary numbers indicated that long volatility and short volatility fund managers both posted losses of 0.85% and 0.99% over the month respectively, while tail risk volatility managers ended the month down 1.84%. The last month was rather eventful for volatility hedge funds, with the VIX index declining to low levels previously seen in early February, before rallying toward end-month following the Trump administration's announcement to impose tariffs on US$50 billion's worth of Chinese exports. On a year-to-date basis, all four volatility strategies remained in the red, with short volatility fund managers posting the steepest losses of 8.87%.
|
CBOE Eurekahedge Volatility Indexes June 2018 returns
|
CBOE Eurekahedge Volatility Indexes
|
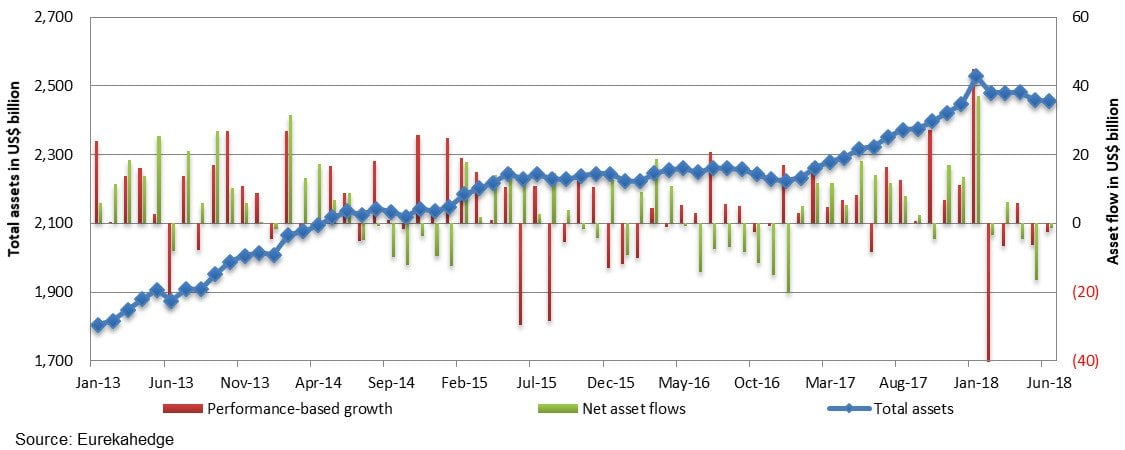
Summary monthly asset flow data since January 2013
Eurekahedge
Launched in 2001, Eurekahedge has a proven track record spanning over 16 years as the world's largest independent data provider and alternative research firm specialising in global hedge fund databases and research. Headquartered in Singapore with offices in New York and Philippines, the global expertise of our research team constantly adapts to industry changes and needs, allowing Eurekahedge to develop and offer a wide array of products and services coveted by institutional investors, family offices, accredited investors, qualified purchasers, financial institutions and media sources. In addition to market-leading hedge fund databases, Eurekahedge's other business functions include hedge fund research publications, due diligence services, investor services, analytical platforms and risk management tools.


