Article by Giannicola Simari (Master in Risk Management, Pisa University), via SSRN with permission
Abstract: This paper proposes a new fundamental analysis based strategy to select a remunerative stock portfolio. The procedure works by selecting an equally weighted small subset of stocks from a broad reference population (for example the constituents of an index) and resetting the selection yearly with reference to the investment date. The selection is based on six filtering criteria, inspired to the value investing paradigm, aimed at evaluating profitability, financial condition and price convenience of each stock. This active approach is compared against a passive strategy, represented by the Index composed by the whole stock population.

Q1 hedge fund letters, conference, scoops etc, Also read Lear Capital: Financial Products You Should Avoid?
As a study case we consider the components of S&P 500 Index from 2000 to 2017. Our strategy is compared with the value of the Index using three time schemes: genuine yearly returns; yearly returns using a monthly one year rolling window; genuine monthly returns. We find that the portfolios selected using the methodology proposed exhibit significantly higher returns than the benchmark.
I. INTRODUCTION
Benjamin Graham is known as the father of value investing, a methodology to select assets securities that, based on fundamental analysis, appear undervalued in comparison with their intrinsic value (Graham and Dodd, 1934, Graham 1949)1. The crucial issue is clearly the determination of the intrinsic value of each asset, given that this quantity is neither observable nor can be computed in a deterministic way. Regarding this point, Oppenheimer (1984) observes that a suitable choice of stock selection rules can produce higher returns than a passive strategy. Grantham (2004) come up with seven selecting criteria, with qualitative as well as quantitative nature: the first three aim at evaluating the financial strength of a company, the next four to measure the returns that can be expected from it. Graham and Zweig (2004) suggest that it is wise not to overpay for a stock investment.
Referring to such prescriptions, in this paper we propose a new way to process financial statements data to select a remunerative stock portfolio. The Graham pillars of intrinsic value estimate, concentrated diversification and buying within the margin of safety2 are the guiding criteria of the approach presented.
II. METHODOLOGY
II.1 Screening Rules and Portfolio Construction
The stocks entering the portfolio are selected using six criteria3 concerning the following financial statement areas:
1. Profitability: three criteria
2. Sound Financial Condition: two criteria
3. Price Convenience: one criterion
Profitability provides information about the firm ability to generate earnings in the future. Sound Financial Condition is related to the company capacity to overcome economic cycles; for example, an increase in leverage can be considered as bad signals of financial risk. Finally, price convenience provides a margin of safety, in the sense that purchasing a stock at a price sufficiently lower than its intrinsic value creates a buffer for an investment to be made at a relatively low level of risk.
Although different time schemes to evaluate the portfolio performance are considered in the next section, the reference strategy of investment assumes that the stock selection is done each year, starting from the investment date; in between two consecutive yearly revisions, the portfolio is kept unchanged.
Considering the S&P 500 components as the reference population, we select a maximum of ten4 assets (this number is here considered a good compromise between risk diversification and return concentration): if more pass the six filtering rules, only the best ten are considered; otherwise, if less satisfy the criteria, only these are taken into account. In the selected portfolio, the K ( 10) tickers included are equally weighted.
The selection criteria are retained constant in the full period of the analysis5.
II.2 Strategy evaluation
The goal of this section is to check whether the selection strategy outlined above produces returns significantly higher than a passive strategy represented by the S&P 500 Index.
We compute the portfolio returns during a generic time period t as
We compare the active strategy with the benchmark using different time schemes6 to evaluate portfolio performance (see Figure 1 for an illustration):
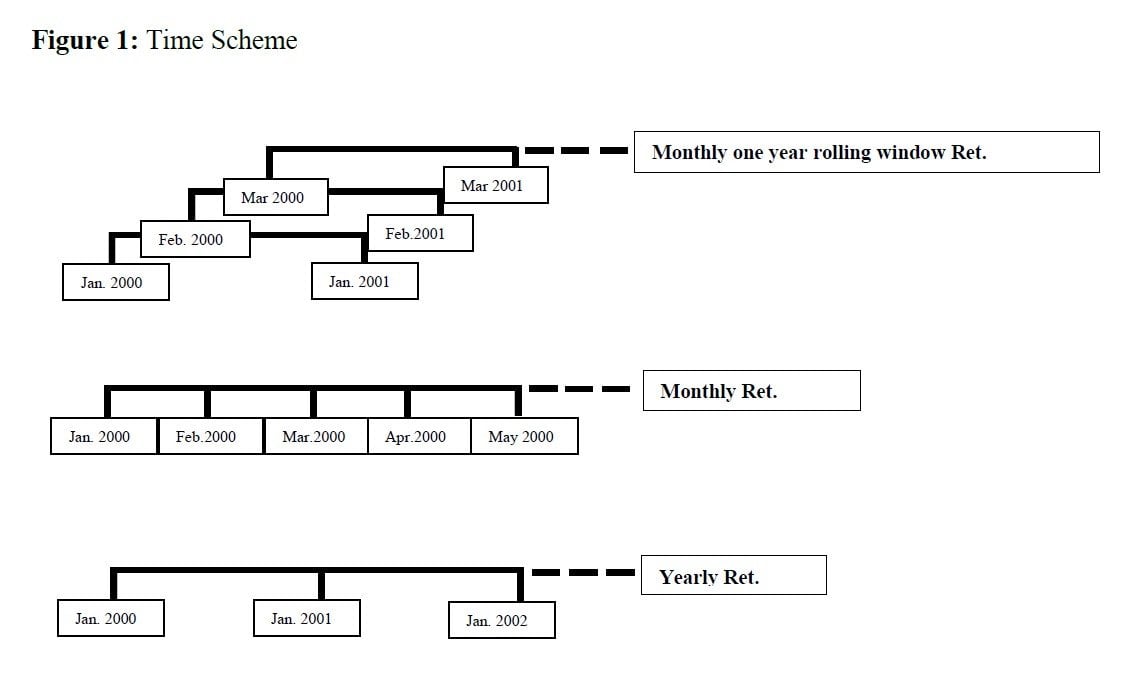
1. Yearly. At the beginning7of a month a new portfolio is selected, computing after one year the corresponding yearly return. This means that in a time period of N years we have N observations, irrespective of the month where the investment started;
2. Monthly one year rolling window. This is similar to the yearly time scheme with the difference that the sequences of yearly returns starting in the twelve months of the year are stacked. This implies that consecutive observations (although refererred to possibly different portfolios) are computed over an overlapping period of 11 months. This scheme is just aimed to increase the number of observation (here 12N) in comparison with the yearly scheme, while retaining the yearly horizon for the investment;
3. Monthly8. The strategy is similar to the yearly time scheme with the difference that the portfolio allocation is changed at the beginning of each month (annualized monthly returns are computed). This scheme gives 12N observations (like the monthly one year rolling window) without overlaps between consecutive observations.
The first time scheme is in line with the reference investment strategy mentioned in the previous section; the price to pay is, however, in the reduced number of observations. The second one is introduced to have a longer time series but the overlapping period between consecutive returns tends to induce autocorrelation. The last one is introduced to avoid overlaps at the price, however, of giving up the yearly horizon.
We benchmark the active strategy using a paired difference test for the null hypothesis that the period differences, , between the portfolio returns produced by the active and the passive strategy has a zero mean. The test statistic is

III. RESULTS
The main results of the analysis are shown in Table 2. The p-values reported in the corresponding column evidence that our value-based investing strategy produces returns significantly higher that the benchmark for all time schemes. The monthly one year rolling window scheme evidences a mean gain from the active portfolio selection higher than 13% on a yearly base; the other two time schemes give similar wide mean differences. The higher variability shown by the monthly time scheme, in comparison with its rolling counterpart, is easily explained by the fact that the yearly window tends to dampen the variability with respect to returns computed over shorter periods.
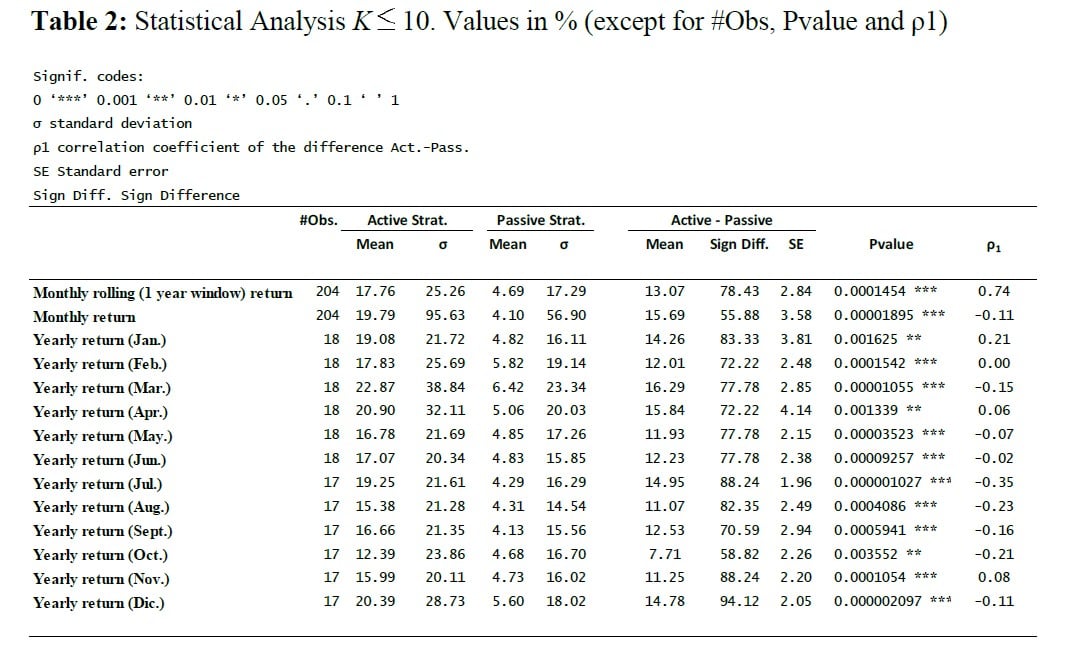
We find that the lower variability of the rolling strategy more than compensate for its higher autocorrelation (column ρ1): the final result is that the standard error of the monthly rolling scheme is lower than its monthly counterpart. The column Sign Diff. reports the number of times, in percentage, the active strategy produces a return higher than the passive one for the whole period.
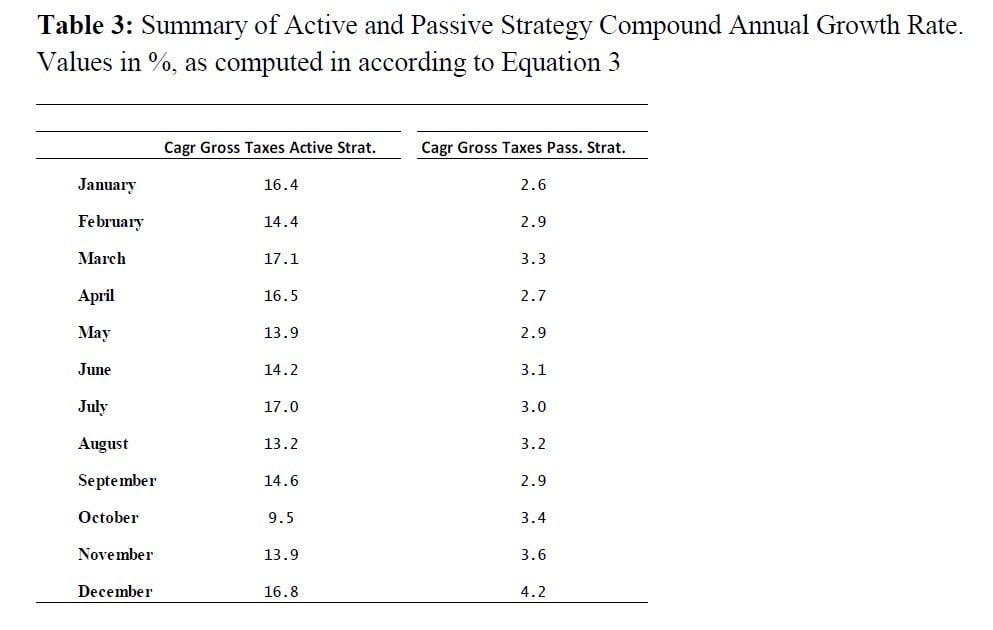
Table 3 reports the value of the yearly CAGR, produced by an investment started in the corresponding month. The order of magnitude of the difference between the two strategies is in line with the results commented above, with the active selection giving average returns considerably higher than the benchmark for all months. There is some variability (for example, the average return from an investment started in March 2000 is 17.1% versus 3.3% of the benchmark, while October 2000 gives 9.5% against 3.4%) but the difference in favor of the value based approach remains relevant.

To give an idea of the practical application of the strategy, Table 4 shows the Portfolio selection made in January 2018.
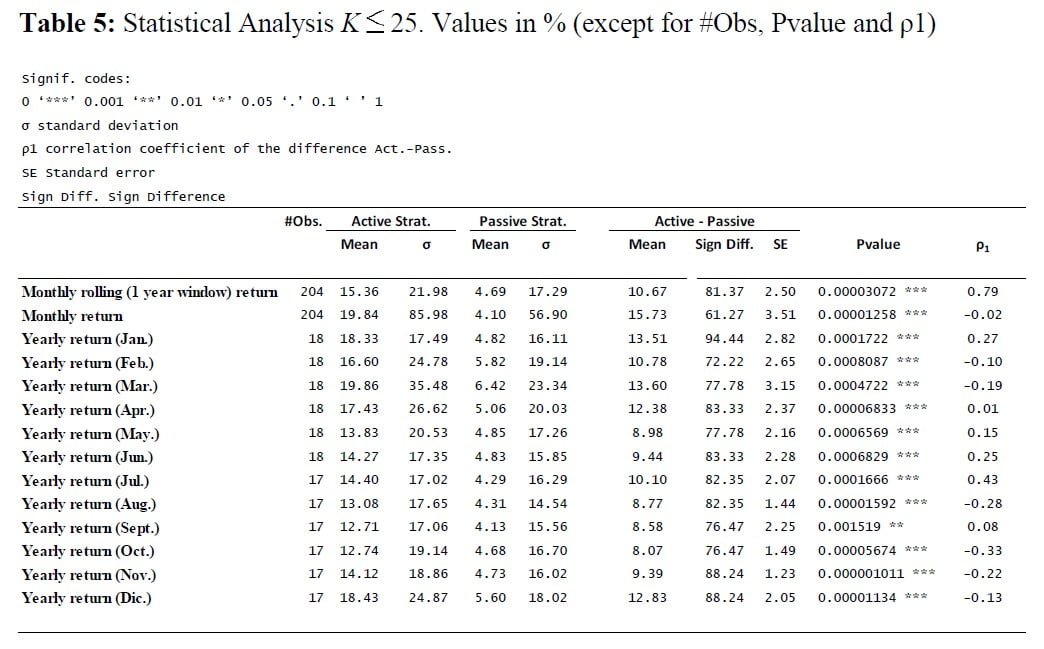
We also tested the strategy considering a maximum of twenty-five assets in the portfolio (cf footnote 4): the results (Table 5) are significantly better than the benchmark for all time schemes but worse than the strategy based on 10 stocks. We expect this because the adopted criteria are able to rank the assets in a decreasing order: top 25 are still better than a passive strategy, but enlarging too much such a number tends to water down returns.
IV. CONCLUSIONS
In this paper we presented a new way to manage the information coming from financials to compose a remunerative stock portfolio.
The results from applying our selection strategy to the S&P 500 components (Section III), confirm substantially the premises of the paper: the importance of selecting stocks which are profitable, in a sound financial condition, and bought at a convenient price. The criteria we propose are able to select, ex-ante, stocks producing significantly better results than the benchmark for all time schemes considered, with an average yearly difference of more than 13 percentage points in the 2000-2017 period.
We tested the proposed selection strategy on the S&P 500 components for two reasons:
a) the corresponding index provides a reliable summary of behavior of the whole U.S. stock market;
b) the financial statements of the companies included on the index are timely and reliable, a necessary condition to implement our methodology.
It would be interesting to test the strategy presented on other equity markets, provided that high quality data are available, to verify whether the corresponding selection criteria preserve their trustworthiness.


