
Jeffrey Gundlach hosts DoubleLine Total Return webcast for the month of June 2018, titled, “Push Me, Pull You.”

Q1 hedge fund letters, conference, scoops etc, Also read Lear Capital: Financial Products You Should Avoid?
TAB I - U.S. & Global Markets
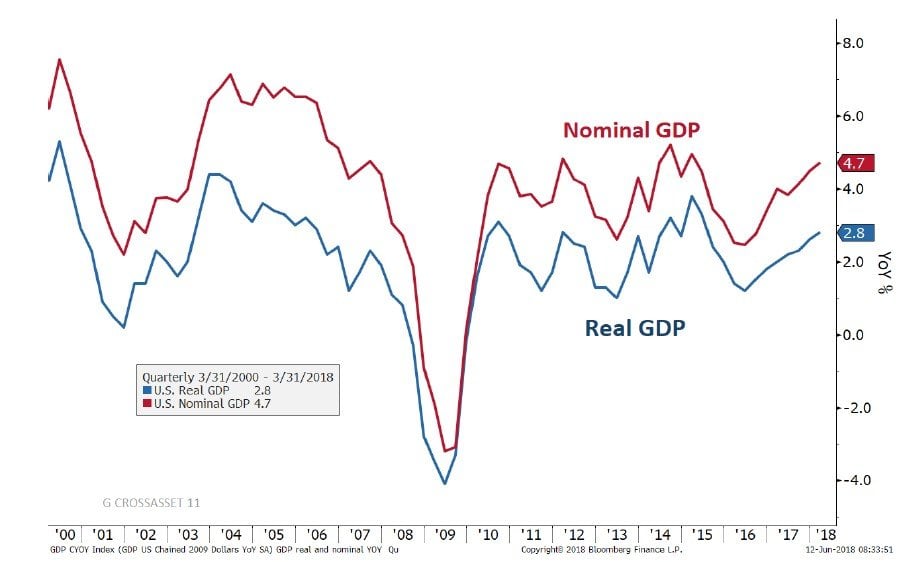
Gross Domestic Product - Real and Nominal
Source: Bloomberg
GDP = Gross Domestic Product includes the total amount of goods and services produced within a given country. Nominal GDP is adjusted for inflation.
You cannot invest directly in an index.
LEI (YoY) Heading into Recessions
January 31, 1968 to April 30, 2018
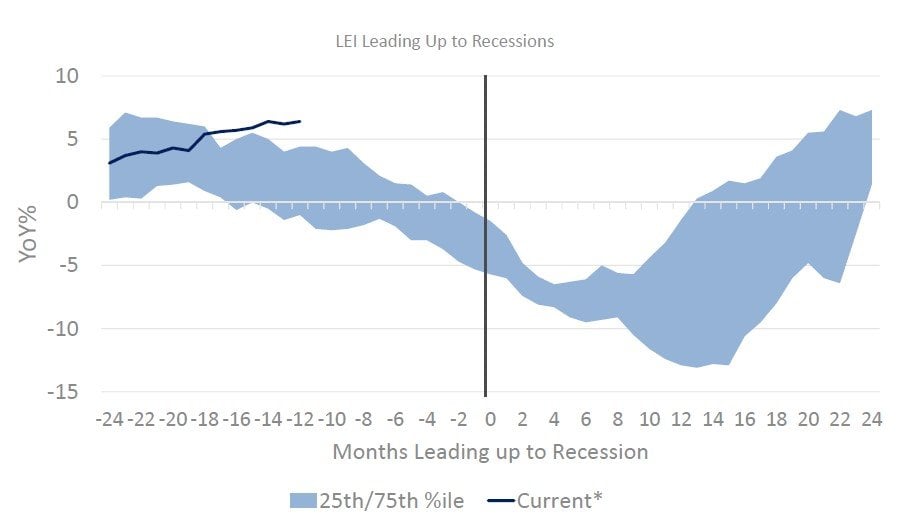
Source: Bloomberg, DoubleLine as of April 30, 2018
LEI = Leading Economic Indicators is a measurable economic factor that changes before the economy starts to follow a particular pattern or trend. YoY = year‐over‐year. You cannot invest directly in an index.
ISM PMI Leading Up to Recessions
December 31, 1947 to May 31, 2018
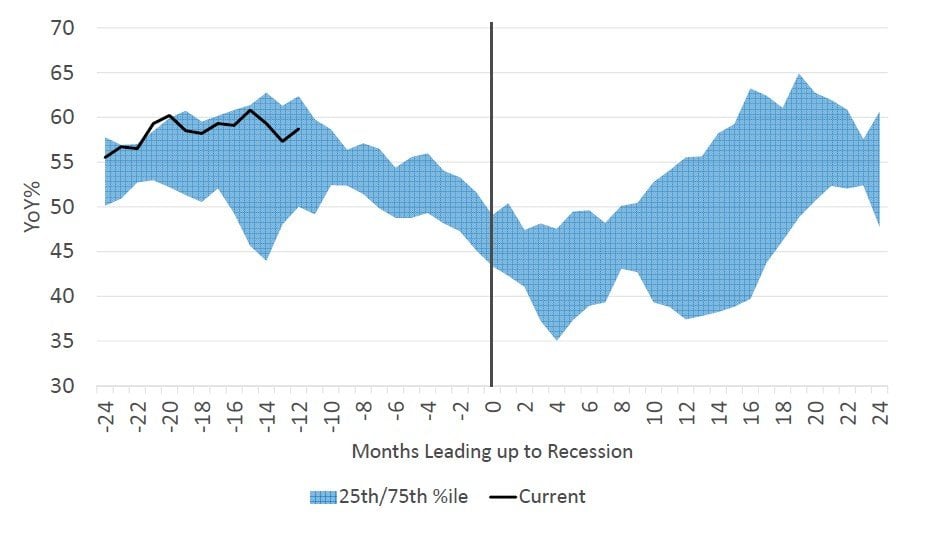
Source: Bloomberg, DoubleLine as of April 30, 2018
ISM = Institute of Supply Management. Purchase Manager’s Index (PMI) is an indicator of the economic health of the manufacturing sector and is based on: new orders, inventory levels, production, supplier deliveries and the employment environment. YoY = year‐over year. You cannot invest directly in an index.
Measures of Business and Consumer Sentiment
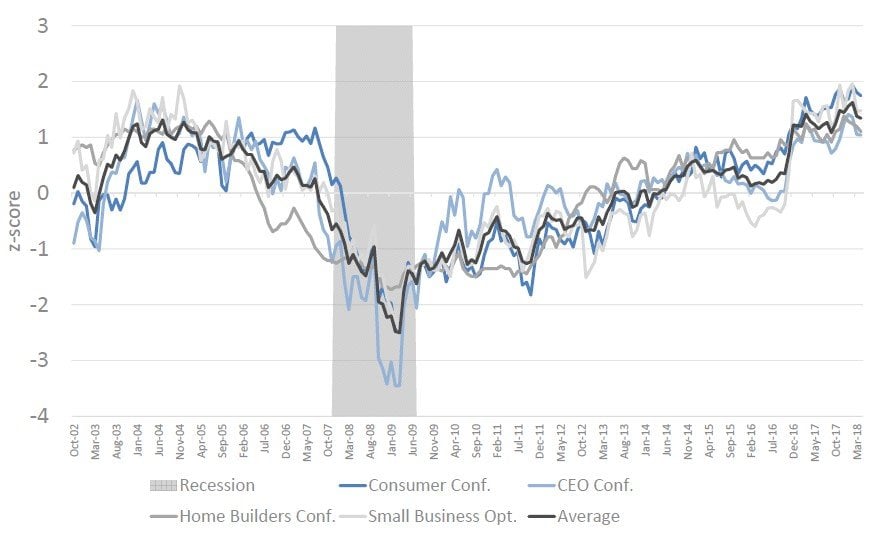
Source: Bloomberg, DoubleLine as of April 30, 2018
Z‐score indicates how many standard deviations an element is from the mean. Standard deviation measures the dispersion of a set of data from its mean. You cannot invest directly in an index.
U.S. High Yield Spread Heading into Recession
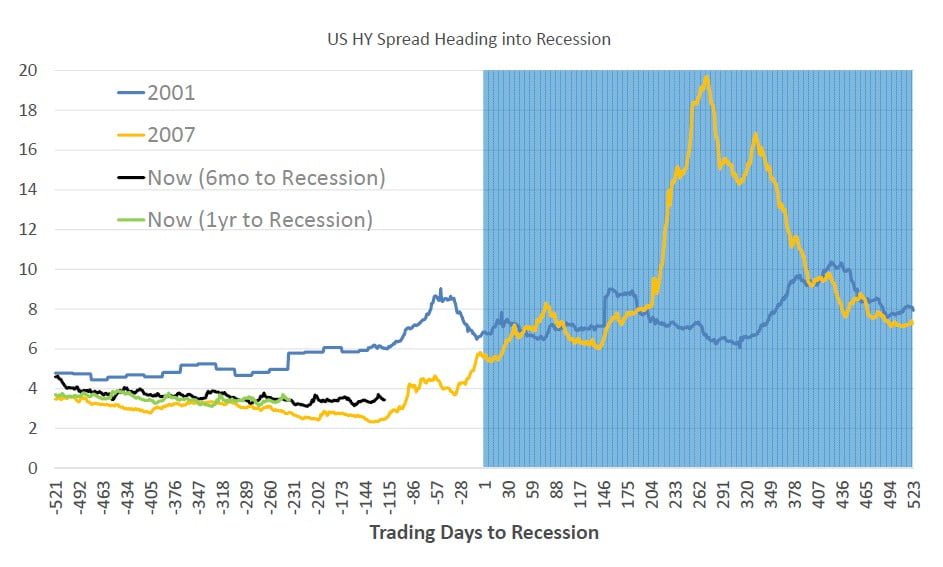
Source: Bloomberg, DoubleLine as of June 8th, 2018
US HY = Moody’s Bond Indices Corporate BAA Index are an average of the daily values for the corresponding month and weekly values are averages for the daily yields of the corresponding week. Spread = the difference between the yields of two bonds with differing credit ratings. You cannot invest directly in an index.
GSCI Energy Sector Performance Heading into Recessions
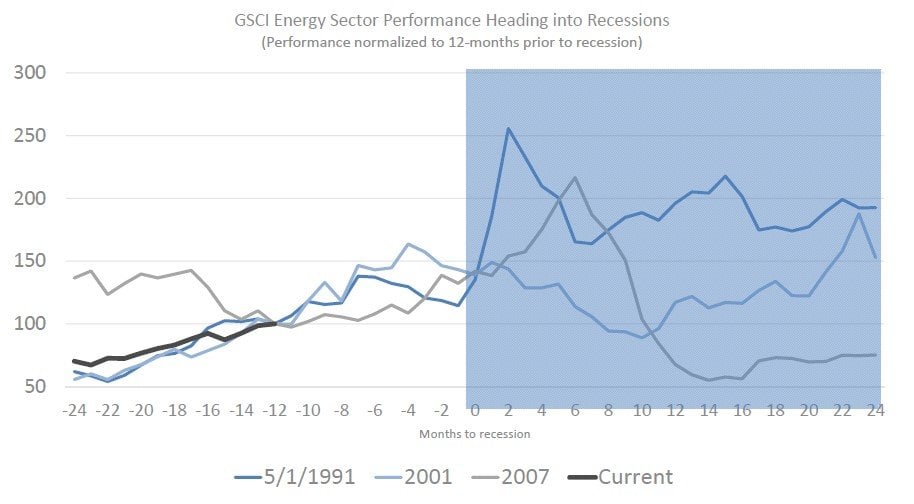
Source: Bloomberg, DoubleLine
S&P GSCI Energy Sector is the energy portion of the S&P GSCI Commodity Index which tracks price movements and inflation in the world economy. It’s designed to be investable by including the most liquid commodity futures, and provides diversification and low correlations to other asset classes. Index start date was May 1, 1991. You cannot invest directly in an index.
See the full PDF below.


