Remember the day you first walked into a bank, possibly with your parents to open your first account? I certainly do, it was when I was ten years old and had saved up my lawn mowing money for the summer. My father told me it was the time I had my bank account so that I could save that hard earned money.

Q1 hedge fund letters, conference, scoops etc, Also read Lear Capital: Financial Products You Should Avoid?
I remember how scared and nervous I was to hand over my money to a stranger, but the banker was very nice to me and helped ease my nervousness.
That was my first foray into the world of money, deposits, and assets. My father talked to me after opening my account about building my assets, i.e., saving money and building my wealth, who knew that someday I would be working at a bank or writing about investing in them one day, crazy how the world works and where our lives can take us.
Assets and liabilities are the heart of a bank, and assets are the driving force of future profitability.
In banking, you are your assets, the loans you make, or the securities you hold.
Loans are the Heart of a Bank
What is a loan?
According to the dictionary:
“The extension of money from a bank to another party with the agreement that the money will be paid back. Nearly all bank loans are made at interest, meaning borrowers pay a certain percentage of the principal amount to the lender as compensation for borrowing. Most loans also have a maturity date, by which time the borrower must have repaid the loan. A bank loan occasionally is called a bank advance.”
Loaning money is a process that has gone on for millennia since man first traded one thing of value for another.
Why are loans the heat of a bank?
Although banks do many things, their primary role is to take in funds—called deposits—from those with money, pool them, and lend them to those who need funds. Banks are intermediaries between depositors (who lend money to the bank) and borrowers (to whom the bank lends money). The amount banks pay for deposits, and the income they receive on their loans are both called interest.
As you can see banks take in people’s money and use it to loan out again to other customers the spread they make on these funds is one of the ways that banks make money. We will discuss this more in an upcoming post.
For now understand that loans act as a way for banks to make income, remember that banks are there to make money, they are not charities.
Next up, let’s take a look at a bank’s balance sheet.
Is Your Bank the Prototypical Bank?
Loans are the heartbeat of a traditional bank, the more they can loan out the more money they are going to make on the spread between interest rates.
The way I look at it, the greater a bank’s loans as a percentage of assets, the closer it is to a prototypical bank.
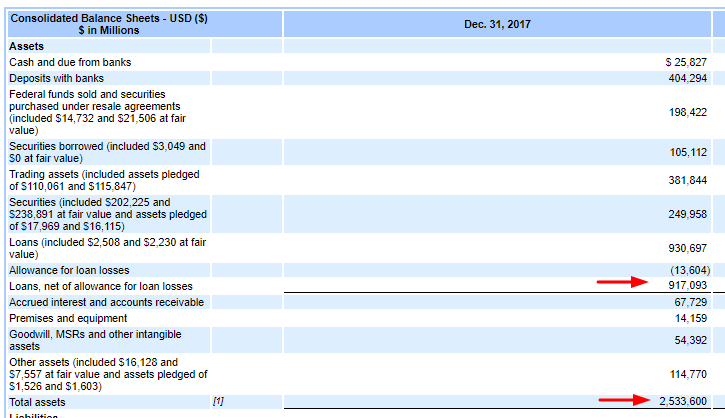
Let’s take a look at JP Morgan’s balance sheet to get an idea of how prototypical their loans are.
So extracting the data:
Loans, net of allowance for loan losses = 917,093
Total assets = 2,533,600
The equation would be as follows:
Loan percentage of assets = Loans / Total Assets
Plugging in the numbers would be:
917093 / 2533600
Percentage of loans to assets equals 36%. That to me indicates that they are not a prototypical bank, in that the majority of their assets do not contain primarily loans.
If you look a little closer at JP Morgan’s balance sheet, you will see a larger percentage of other items including securities and trading activities.
The percentage doesn’t surprise me as JP Morgan is known for the investing activities and I know they generate a larger portion of their income from investments than say, Fifth Third Bank which has a 63% percentage of loans to assets. You can find the relevant data on the balance sheet here.
This percentage is not necessarily good or bad; it gives you a little insight into how your bank might make money.
Let’s say you are investigating investing in a bank and you see that a larger portion of their assets is tied up in securities. That could give you pause if you are uncomfortable with that aspect of a bank’s assets.
Just as loans tell the story on the assets side, deposits tell the story on the liabilities side. The typical bank takes in deposits and makes loans.
Deposits and Liabilities
Next up are two ratios that help us define how typical our bank is.
The first will be Deposits/Liabilities
Deposits are awesome for banks the same way you complain about the paltry savings rates they offer. When you deposit your money at a bank, it allows them to use those funds for loans, albeit very cheaply.
If a bank isn’t able to attract deposits, it has to take on a lot of debt or issue stock on the equity side, which is much more expensive. Taking on more debt is a practice we don’t like, at all.
Not being able to attract deposits can also lead to riskier lending practices, also a big no-no. Remember the recent banking crisis anyone?
Calculating this ratio is quite simple, take the deposits and divide it by the total liabilities.
Loans = 917,003
Liabilities = 2,533,600
Therefore the ratio is 917003 / 2533600
Loans/Liabilities ratio is 36%, which of course matches the Loans to Assets ratio. All of which continues to reinforce that JP Morgan is more than just a bank that makes loans.
Loans/Deposits
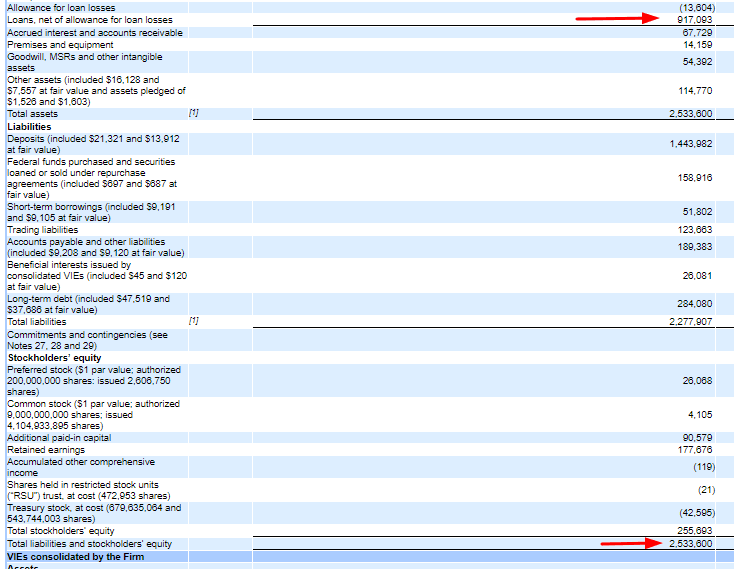
Next, let’s look at the liabilities side of the balance sheet. In regards to a bank, one of the biggest liabilities is going to be monies deposited.
True, they are the lifeblood of a bank, but they are also a liability because one day, the depositors are going to want their money back.
The loan to deposit ratio measures the liquidity of each bank, so if a bank takes in $1 in deposits and loans out that $1, they will have a 100% LDR (loan to deposit ) ratio. The ratio also means that the bank won’t have any cash on hand to deal with any contingencies.
That said, the overall trend of a year-on-year decline for most of the banks here is in contrast to the trend seen for the U.S. banking industry over this period. Data compiled by the Federal Reserve shows that the LDR figure for the industry first fell from 80.5% in 2012 to 75.5% in 2014 before recovering to almost 80% by 2016. Notably, the change in the ratio for JPMorgan mirrors this trend. U.S. Bancorp and Wells Fargo have seen their LDR decline steadily thanks to their above-average deposit growth over recent years, whereas the decline for Bank of America and Citigroup can be attributed to their focus on running off non-core loans since the economic downturn.
Let’s take a look at JP Morgans Loan to Deposit ratio.
To calculate the ratio, we use the formula:
LDR = Loans / Deposits
For JP Morgan our numbers from the balance sheet are as follows.
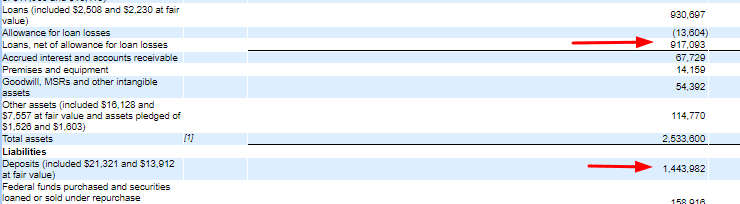
Loans = 917,093
Deposits = 1,443,982
Therefore the ratio for JP Morgan is
LDR = 917093 / 1443982
LDR = 63.50%
This number is pretty typical for JP Morgan and has seen the trend continue over the last five quarters of balance sheet data that I have looked into.
- 7%
- 6%
- 4%
- 4%
- 5%
When you consider the loan to deposit ratio of JP Morgan, it appears lower than say US Bank which is typically in the 80s. But US Bank is much more of a traditional, conservative bank.
Whereas JP Morgan is a custodian bank, which means that they are more involved in the caretaking of securities, which means more of their business model centers around the stock market and the securities traded there.
Bad Loan Percentage (Non-performing Loans/Total Loans)
Now we will start to look at one of the risk factors of banks. Non-performing loans.
What are non-performing loans? Well, they are loans that the borrower is not making interest payments or principal payments.
Typically this means that the payments are delinquent for 90 days for a commercial loan and 180 days for consumer loans. The delinquent payments mean it is in default or close to default. The likelihood of the debtor resuming payments is pretty low.
The debtor can begin making payments again, and the loan is then considered reperforming, even though they may not have caught up on the missed payments.
Non-performing loans are considered bad debt and a high percentage of these can affect the stock price.
Banks that carry non-performing loans have the option of taking steps to recover what they are owed. For loans that are backed by specific assets like cars and homes, they can pursue foreclosure or repossession.
For loans not backed by assets, recovery is much more difficult.
“Banks also have the option to sell non-performing loans to outside investors or collection agencies. With the latter, what typically happens is that the debt is sold at a reduced price to the agency, which then attempts to collect that debt and make money on non-performing loans that are eventually repaid. Banks can also partner with collection agencies, which often agree to pursue bad debts in exchange for a percentage of whatever amount is recouped.”
A large percentage of non-performing loans can affect a bank negatively, but it can also affect outside borrowers. When loans stop performing, it affects the interest payments a bank can collect, which affects their income. Interest payments are a major source of income for banks.
Non-performing loans don’t just cost the bank money, but it also causes it to have less money available to loan out again.
Investors looking to invest in banks look closely at this ratio as it can tell you how good a bank is at vetting it’s loan customers and ensuring it can continue to grow its income by avoiding bad loans.
Now that we understand a little bit better what a non-performing loan is and how it can affect our bank let’s take a look at how we would calculate it.
The formula would be:
Bad Loan Percentage = Non-performing loans / Total Loans
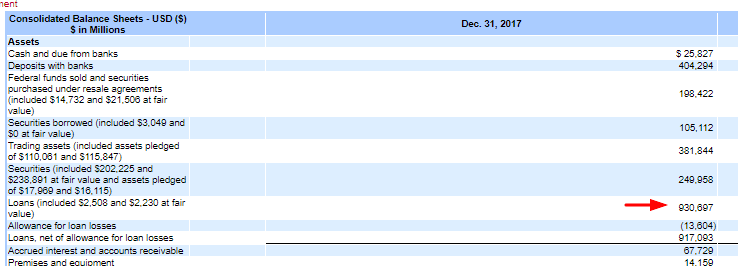
Total Loans = $930,697
Next to find the non-performing loans we are going to need to look at the notes to the financial statements. We have not delved into this much along our investigations, but this is a wealth of information and can be a little overwhelming.
For our purposes here we are looking at the section in the notes detailed Allowance for Credit Losses.
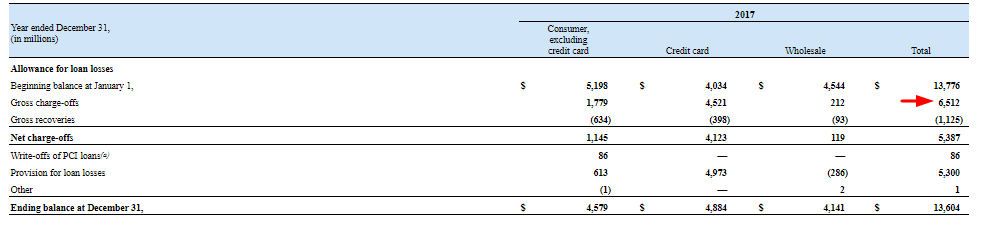
Our number is going to be labeled Gross Charge-offs, and that would be $6512.
Plugging everything into our formula.
Non-performing loans = 6512
Total loans = 930697
Non-performing loans percentage = 6512 / 930697
Non-performing loans percentage = 0.69%
This is a great number, we are looking for anything under 1%.
Let’s take a look at the last five years to see if this is a trend for JP Morgan or just one good year.
- 2016 64%
- 2015 64%
- 2014 82%
- 2013 01%
- 2012 50%
It appears to be a trend that they are doing a better job of managing their credit risk.
Of course, this is going to be driven by economic conditions as well. Consider the recent housing market crash; this drove many non-performing ratios well above five percent.
Coverage of Bad Loans (Allowance for non-performing loans/Non-performing Loans)
Banks, of course, know that not every loan is going to get paid back, so they take earnings hit and establish an allowance for bad loans.
Unfortunately, banks can play games with this allowance, as you can probably imagine. Specifically, they can boost their current earnings by not allowing enough for loans that will eventually default.
One way for us to protect ourselves from this manipulation and ensure that the bank can cover any bad loans is to calculate this coverage ratio.
The coverage ratio measure’s the bank’s ability to meet its financial obligations. Generally, the higher the coverage ratio, the better the ability of the bank to meet its obligations to the lenders.
We can also study this trend to check the bank’s financial position and see if there are any changes.
Let’s take a look at calculating this ratio.
Coverage ratio = Allowance for non-performing loans / non-performing loans
Gathering the numbers.
Allowance for non-performing loans = $13,604
This number we found on the balance sheet right below the total loans.
Non-performing loans = $6512
We had used this number from the previous section, which we found in the notes to the financial statements.
So, plugging all the numbers, we get:
Coverage ratio = 13604 / 6512
Coverage ratio = 2.089 X 100 = 208.90%
Any number over 100% is what we are looking for; this means they are more conservative in their lending allowances and can cover any bad loans.
As before let’s take a quick look at JP Morgan’s coverage ratios to see how they have done over the past five years.
- 2016 81%
- 2015 63%
- 2014 00%
- 2013 81%
- 2012 13%
They have done a fantastic job managing their credit risk from a bad loan perspective. Nice conservative numbers which can help one sleep well at night knowing that JP Morgan is doing it’s due diligence by being a responsible lender.
Return on Equity
Return on equity is a great way to measure management’s ability to generate profits for every dollar earned. This particular formula is great for comparing related fields, i.e., banking.
So what is a return on equity?
“Return on equity (ROE) is the amount of net income returned as a percentage of shareholders equity. Return on equity measures a corporation’s profitability by revealing how much profit a company generates with the money shareholders has invested.”
The formula takes the net income or profit of a company and measures it against the money that we shareholders invest in the company.
A quick note, ROE or return on equity can be a quick way to gauge whether the company is an asset creator or a cash cow.
Ideally, we are looking for a return on equity of the 15% to 20% range or higher. Keep in mind that high growth companies are going to have ridiculously high numbers.
On the flip side of that equation, a low return on equity means that the company is not generating much in the way of assets for our invested capital. If for example, the number is 8%, then the company is creating 8 cents of assets per one dollar of investments.
The formula is as follows:
Return on Equity (ROE) = Net Income / Book Value of Equity
For more details on how this formula works and where to get the numbers please go here.
Let’s take a look at the ROE of our bank of the day, JP Morgan.
- 2014 31%
- 2015 45%
- 2016 10%
- 2017 85%
- TTM 67%
Very consistent, and not too bad results either.
Return on Assets
According to Warren Buffett, the answer is pretty simple. Look to the bank’s return on assets or ROA.
“Well, a bank that earns 1.3% or 1.4% on assets is going to end up selling above tangible book value. If it’s earning 0.6% or 0.5% on the asset, it’s not going to sell. Book value is not key to valuing banks. Earnings are key to valuing banks. Now, it translates to book value to some extent because you’re required to hold a certain amount of tangible equity compared to the assets you have. But you’ve got banks like Wells Fargo and USB that earn very high returns on assets, and they at a good price to tangible book. You’ve got other banks … that are earning lower returns on tangible assets, and they’re going to sell — they’re going to sell [for less].”
The attraction of return on assets is its simplicity. It captures so much of the essence of a bank, without getting caught up in the complexity of the big bank accounting mess.
So what is a return on assets?
According to Investopedia.
“Return on assets (ROA) is an indicator of how profitable a company is about its total assets. ROA gives an idea as to how efficient management is at using its assets to generate earnings.”
Return on assets tells you what earnings were created from invested capital or assets. Return on assets can vary from the company and will be very dependent on the industry the company is in.
This is why when using return on assets as a comparative measure, it is best to compare it to companies previous ROA or the ROA of a similar company.
The assets comprise of debt and equity of a company, both of these types of financing are used to fund the operations of the company.
The return on assets figure gives the investors an idea of how effectively the company is converting the money it has to invest in income.
The higher, the better because the company is earning more money on fewer invested dollars.
Management’s most important job is to make good choices when allocating its resources and the best managers are great capital allocators.
These allocators can create more assets from the assets they already have and create more income for the company from those assets.
The formula for Return on Assets or ROA is as follows:
ROA = Net Income / Total Assets
For more in-depth explanation of how this ratio works, please go here.
As before let’s take a peek at how JP Morgan has done the last five years generating a return on assets.
- 2014 87%
- 2015 99%
- 2016 02%
- 2017 97%
- TTM 04%
Pretty darn good, when calculating return on assets for a bank, we need to remember that banks are highly leveraged, so a 1% ROA indicates huge profits.
Book Value per Share
The last metric we are going to look at is book value per share or BVPS. Again this is a pretty simple metric to calculate, the trick as always is knowing where to look for the information.
Why book value per share?
This is another tool in our toolbox to help us find the value of a firm, either a bank or other financial institution. Of course, we can use this with other companies as well.
According to Investopedia:
“Book Value per common share is a measure used by owners of common shares in a firm to determine the level of safety associated with each share after paying all debts accordingly.
Should the company decide to dissolve, the book value per common share indicates the dollar value remaining for common shareholders after liquidating all assets, and paying all debtors.”
Book value per share is an accounting measure based on historical transactions.
Warren Buffett states in every annual Shareholder letter that he writes the book value of Berkshire Hathaway as a way of keeping score.
His thoughts on the importance of book value versus intrinsic value were laid out in his Berkshire 1993 Letter:
“It is important to understand, however, that the two terms – book value and intrinsic business value – have very different meanings. Book value is an accounting concept, recording the accumulated financial input from both contributed capital and retained earnings. Intrinsic business value is an economic concept, estimating future cash output discounted to present value. Book value tells you what has been put in; intrinsic business value estimates what can be taken out.”
The formula is relatively straightforward and is as follows.
Book Value Per Share (BVPS) = ( Total Equity – Preferred Stock) /
Shares Outstanding
To learn more about this metric and how to find the relative data, please go here.
Let’s take a look at JP Morgan’s book value per share over the last five years.
- 2014 98
- 2015 46
- 2016 06
- 2017 04
- TTM 48
All great numbers and we can see that it is growing over the previous five years. The great thing about this metric is that it shows the real economic value of a financial institution.
Final Thoughts
Working through a balance sheet is not “hard,” it just takes a little bit of time and know-how. Hopefully, after working through this post, it will be a little easier.
Like anything, with practice it gets easier and more comfortable.
The metrics and ratios that we looked at will give you a much better idea of what kind of bank your investment is. Also, it will provide you with an excellent idea of how whether they are good at creating assets and using those assets to power their company.
The metrics and ratios can be used for other entities as well, in particular, return on equity, return on assets, and book value per share.
Investing in banks can be a little daunting, but as we peel away the onion of the balance sheet, it starts to look a bit less overwhelming. Warren Buffett has mentioned numerous times that we should value a bank the same way we value any other company.
Banks have assets and liabilities just like any other company, true some of the assets and liabilities are a little more involved than say Apple.
But as you have seen this is something you can do, and I am here to help.
As I have said before, these metrics and ratios are just part of the process of determining the value of a company. Never, ever buy a company solely on one or two metrics alone.
These numbers are to help us understand the company and what they do and how they make money. They help us tell a story that we can use to understand our possible investment better.
As always, thank you for taking the time to read this, and I hope that you have found something useful and helpful.
Please reach out if you have any questions or concerns.
Take care,
Dave
Article by Dave Ahern, Intrinsic Value Formula


