
Original article by UpFina
In this article, we will discuss some of the countervailing trends which are occurring to help you formulate a balanced outlook on the markets and the economy. It’s easy to cherry pick data to fit an agenda, but that doesn’t do you much service. There’s always valid counter arguments that need to be discussed no matter how great the thesis is. Two brilliant investors can look at the same data and come to completely different conclusions, and both be right, though not at the same time.

Q1 hedge fund letters, conference, scoops etc, Also read Lear Capital
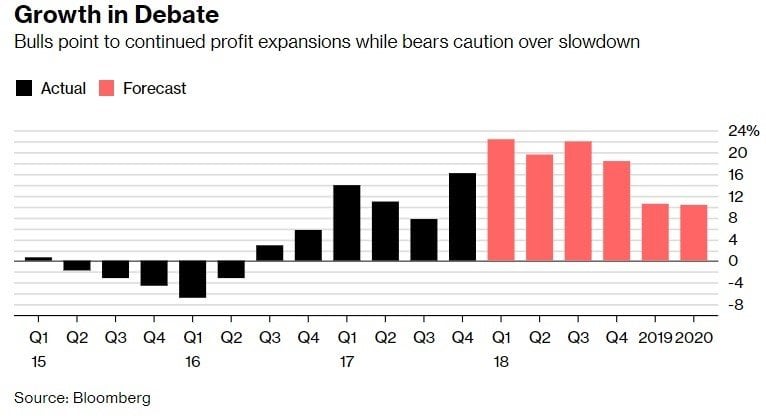
Peak Earnings Growth?
Earnings growth in Q1 looks so great investors are wondering if the cycle peak is here. The chart below shows the growth in Q1 is 22.4% which is higher than the other forecasts which don’t include any actual results.
Source: Bloomberg
However, comparing actual results to forecasts isn’t an ‘apples to apples’ comparison because earnings reports usually beat estimates. Heading into Q1 earnings growth was expected to be 17.1%. To be clear, Q1 is shaping up to be a better than average earnings season. The point here is that the 19.6% growth expected in Q2 doesn’t signal earnings growth peaked because the results will be beaten. Earnings growth is expected to be great for the rest of this year. Only in 2019 is the growth rate expected to fall significantly.
The chart below shows a more negative picture.
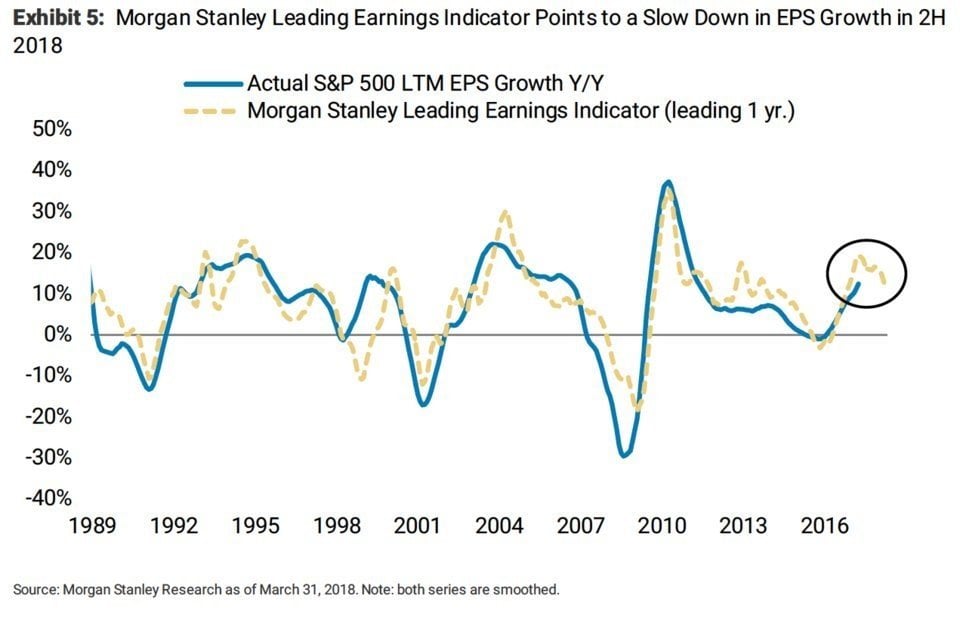
Source: Twitter @TN From Morgan Stanley
The chart shows the Morgan Stanley Leading Earnings Indicator pushed ahead one year compared to the actual trailing 12 months of EPS growth. These two indicators have had a high correlation in the past 30 years. The circled yellow dotted line shows the EPS growth is expected to slowdown in the 2nd half of 2018. Earnings growth in the second half will depend on the strength of the economy and strength of the dollar. 2017 priced in the great earnings growth for 2018. If 2018 trading is pricing in next year’s earnings growth, it explains why stocks haven’t rallied on current great results.
Peak Growth Isn’t Bad For 1 Year Returns
The good news is that historically peak earnings growth isn’t as dire for stock performance as it seems. The chart below shows the past 5 instances where earnings growth peaked.
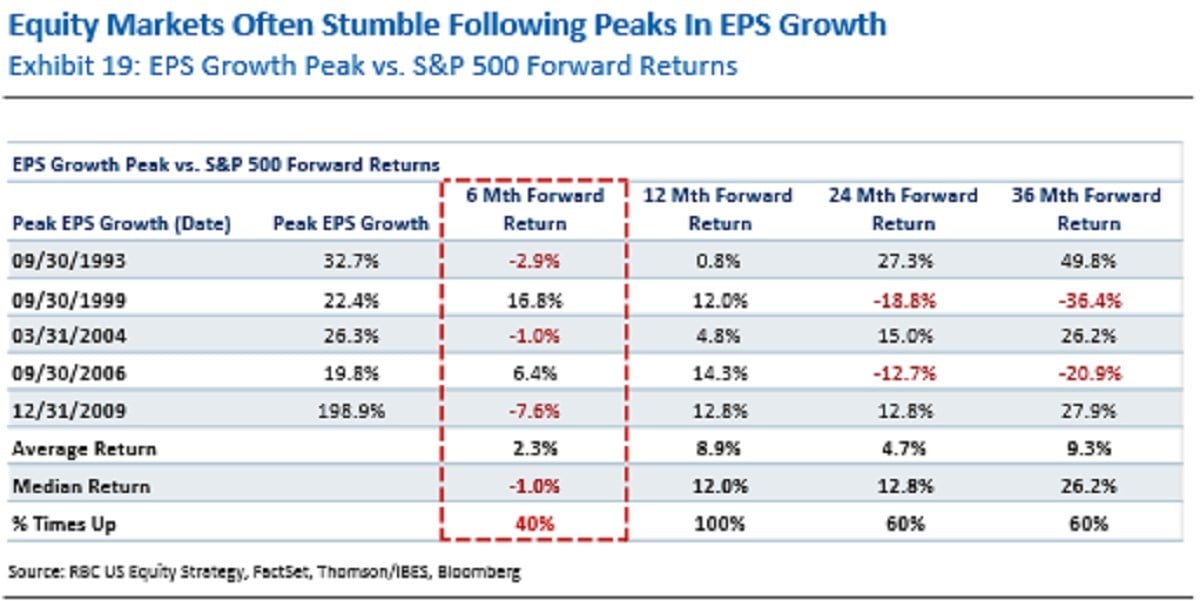
Source: Bloomberg
Stocks did poorly in the first 6 months as the median return is a 1% decline. If Q1 2018 ends up being the earnings growth peak, these last few months of stagnant stock prices are consistent with those results. However, after that stumble, stocks regain their footing as the average 12 month return following the peak in EPS growth is 8.9% with a 100% win rate.
Private Sector Yield Curve Inverted
This earnings growth peak is unusual because it is going against the cyclicality of the economy. Global growth is slowing in 2018, especially in Europe. Growth in America declined, but the weakness hasn’t been as sharp as other countries partially because of the tax cut. The point is the earnings growth is at an unusual point where it isn’t following the economy. Therefore, growth can fall quicker than usual. Tough earnings comparisons and a weaker economy could really make the 2019 earnings look bad.
One signal that the economy will weaken is the Wicksellian interpretation of the U.S. private sector yield curve which is the Baa corporate bond yield subtracted by the average prime rate. As you can see from the charts below, this private sector rate is on the cusp of inverting.
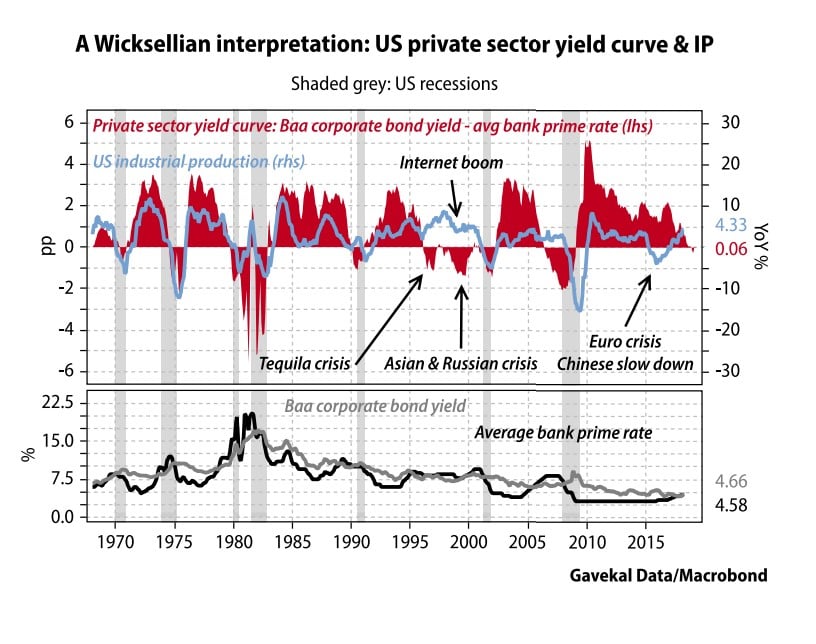
Source: Bloomberg
In the past, the curve inverted during recessions. The two exceptions are in the 1990s which are labeled as the Tequila Crisis and the Asian & Russian Crisis. The industrial production growth was positive in those periods signaling a recession wasn’t afoot. Once again, industrial growth is positive, meaning there could be a mini-crisis rather than a full blown recession. Industrial production had a rare hiccup outside of a full economic recession in 2015-2016 when there was only a manufacturing recession.
Weak C&I Lending Growth
While year over year industrial production growth is positive, the C&I loan growth isn’t great. As you can see from the chart below, going back until 1970, C&I loan growth has only been negative following recessions.
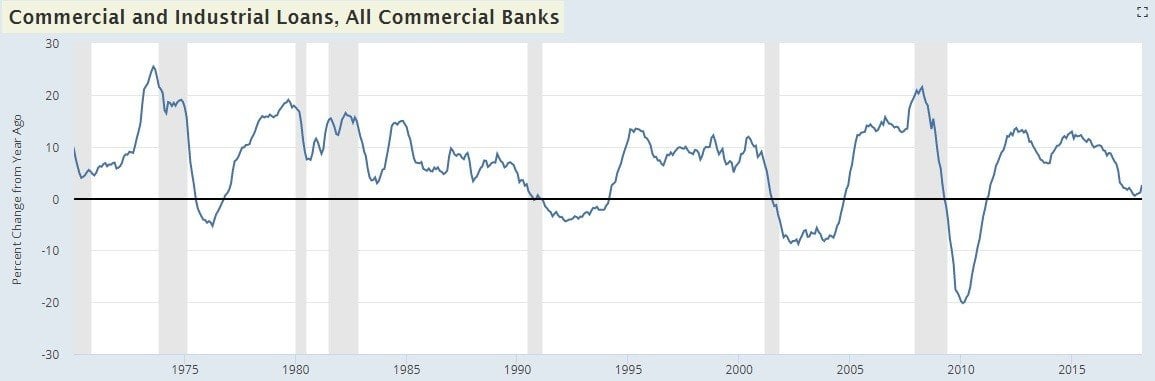
Source: FRED
There have even been recessions where growth never fell into the negatives. The growth rate fell to 0.5% in November 2017, coming close to firing that recession warning. Since then, growth has rebounded to 2.6%, possibly because of easier year over year comparisons. The point with showing this chart is to counter the industrial production growth indicator.
Counterpoint: Capex Growth Expected To Expand
The counter to the very weak C&I lending growth is the potential for a rebound based on the tax cut which provided corporations with excess capital. The chart below shows the capital spending from the 130 firms which have reported earnings in Q1 2018.
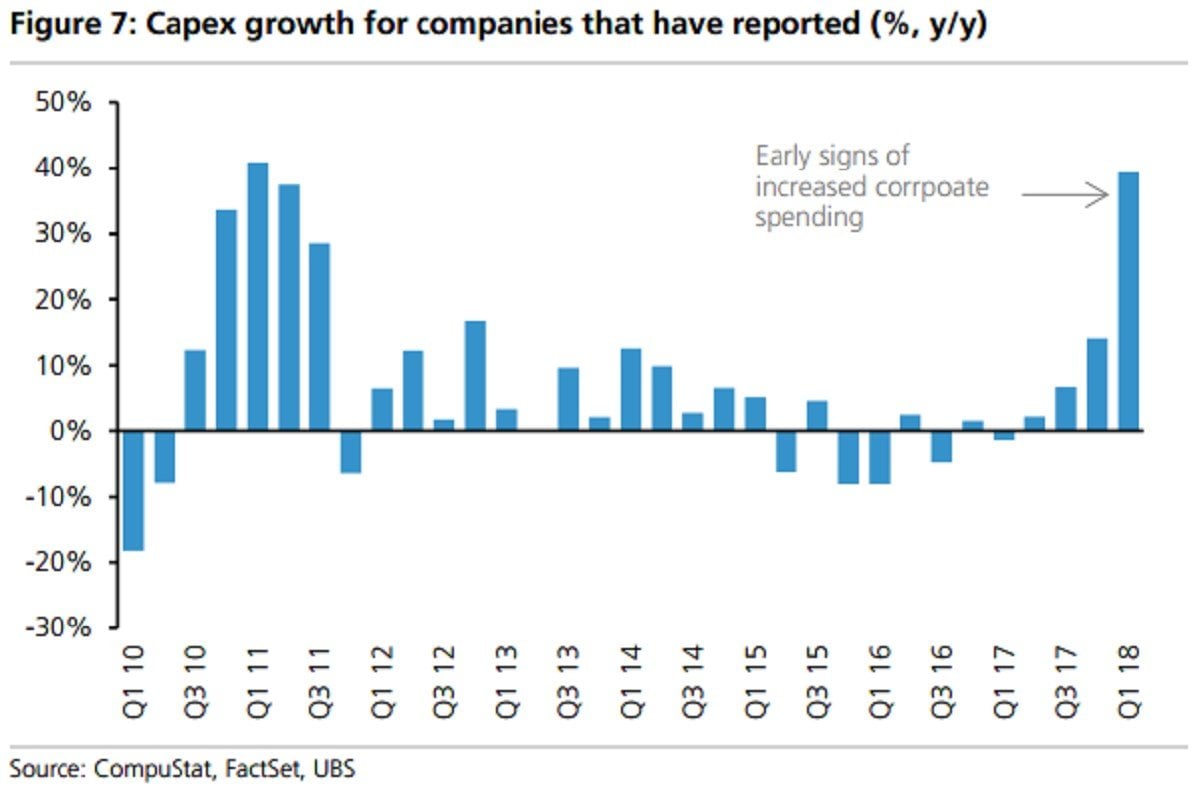
Source: Bloomberg
Capex spending is up 39% which is the fastest growth rate in 7 years. Buybacks were only up 16% and dividends were up 11%. The C&I lending growth bump can be sustainable if firms ramp up capex this year. Increased corporate profits could help the economy.
Banks Looking Weak Despite Improved Net Interest Margins
Investors who were bullish on the bank stocks in 2018 because of improving net interest margins, deregulation, and the tax cuts were sorely disappointed as the major bank stocks shirked earnings beats. One of the reasons for this is the weak loan growth. As you can see from the chart below, the current 3.4% growth rate is near where growth has fallen to after recessions.
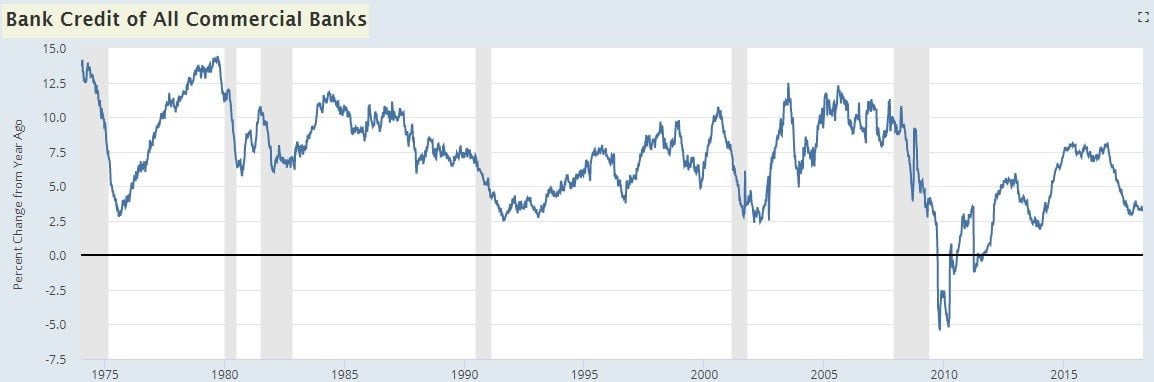
Source: FRED
Low single digit growth is terrible as only the 2008 crisis caused loan growth to fall to the negatives. The latest weak growth is a big negative for the economy.
Conclusion
We presented a series of positive and negative concepts for you to review to determine where you stand. There are great arguments on both sides. The Fed can easily push the scale in favor of the bearish investors if it raises rates too quickly. Four rate hikes in 2018 along with the QE unwind would be very hawkish policy which could be enough to push the treasury yield curve towards an inversion and catalyze a bear market in stocks despite the hugely positive earnings growth, not to mention increasing the potential of a recession in 2019.
Disclaimer: Before making any investment decision you must read and accept our full disclaimer at www.upfina.com/disclaimer


