Saga Partners letter to investors for the first quarter ended March 31, 2018.

Q1 hedge fund letters, conference, scoops etc, Also read Lear Capital: Financial Products You Should Avoid?
Annual Luncheon
Saga Partners is excited to host our first annual luncheon next month. While our investors live all across the country, we are excited for those who are able to attend at our world headquarters in Cleveland, Ohio. We are happy to have Umberto Fedeli as a guest speaker, followed by a brief presentation, and an opportunity to ask some questions. It should be a fun time to enjoy some good food and drinks, and we hope to see you there!
1Q18 Results
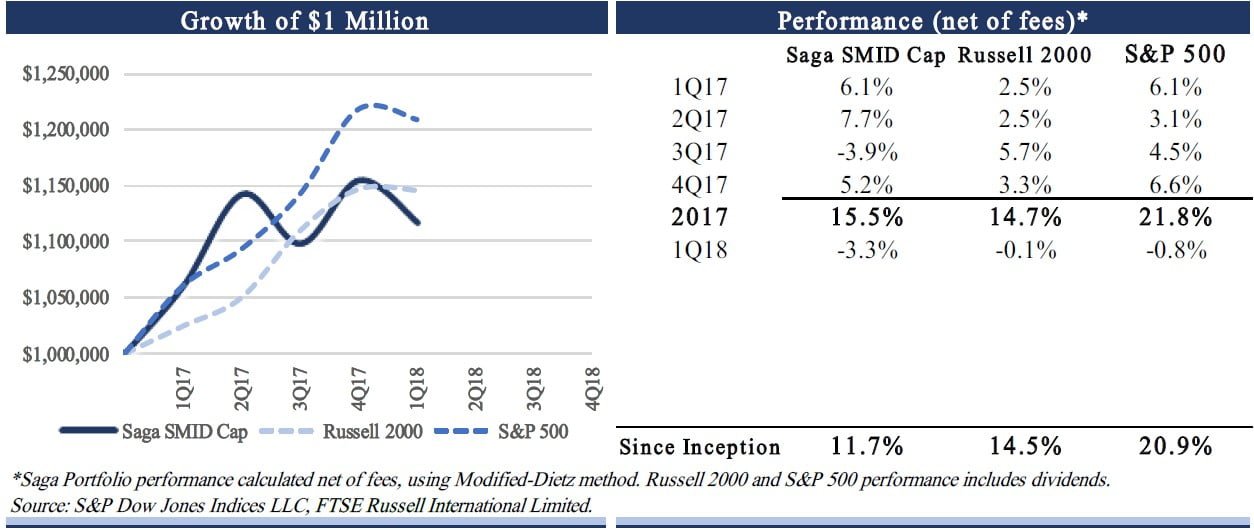
During the first quarter of 2018, the Saga SMID Cap Portfolio declined 3.3% net of fees. This compares to the overall decline, including dividends, for the Russell 2000 and S&P 500 Index of -0.1% and -0.8%, respectively. Since inception on January 1, 2017, the Saga SMID Cap Portfolio returned 11.7% net of fees, compared to the Russell 2000 Index and the S&P 500 of 14.5% and 20.9%, respectively.
Interpretation of results
The purpose of the Saga SMID Cap Portfolio is to compound capital over the long run, but it will not come in predictable, consistent returns every quarter. It does not concern us one iota if we underperform in any given quarter or year, just like we will not get overly ecstatic in any quarter if we significantly outperform. Each one of our 15 investments has a separate investment thesis, which by our analysis is expected to provide our required rates of return.
We refer to the Russell 2000 Index as a benchmark because the portfolio consists of small and mid-cap companies and the Russell 2000 is an easy alternative option for a passive investor. When managing a relatively concentrated portfolio of 12-20 holdings with minimal company overlap with the index, portfolio performance will likely have limited correlation to the benchmark. It is expected there will be periods of outperformance and underperformance.
Know what you don’t know
The first quarter ended the extended period of historically low market volatility. After a record beating January, the market shifted from excitement over lower corporate taxes to fears of higher interest rate and inflation expectations, and more recently to talks of trade wars. All of this is interesting to read and talk about, however it does not have any major influence in our day-to-day investing decisions.
In the short run, stocks can swing wildly based on unimportant and unpredictable factors. Much like a private business owner who does not get daily quotes on the price of their business, we are agnostic to daily stock movements. What we do care about is the fundamental performance of the companies we hold. This does not necessarily mean earnings per share, though we inevitably expect our holdings to generate cash flow to shareholders. We care whether the company is increasing its competitive advantage, or “moat”. Over the long run, a company’s stock price will increase in-line with the growth in intrinsic value of the business.
We make no attempt to forecast either business or stock market cycles. The news, business publications, and talking heads on CNBC generally focus on the movements of macroeconomic indicators, attempting to use them to predict how they will impact the markets.
Macroeconomic variables can have a very real impact on the earning power of individual companies. However, accurately forecasting these variables and subsequently knowing how they will impact a specific company is beyond our scope. Economic markets are complex systems with infinite interdependent variables working together. We prefer to not waste time on analyzing things we cannot know or predict and instead spend our energy on what is potentially knowable, such as the underlying microeconomic fundamentals of a company.
How we differ from traditional value investors
Traditional “value stocks” are considered to have low valuation multiples relative to earnings, cash flow, book value, or some other financial metric. In our experience, low multiple stocks often deserve their valuation whether due to their lower quality or unpromising outlook. While historic operating metrics can often be used as a proxy for future performance, they are not always representative of results to come, therefore recent results can provide misleading valuations. Today’s share price is the sum all the future cash that can be taken out of the company, discounted at an appropriate rate.
Our investment process can often lead to ideas that may not screen as traditional value stocks. We focus first on the qualitative characteristics of a business to evaluate if it has a durable competitive advantage. We must feel confident about the company’s earnings power in five or ten plus years out. Only after we determine a company meets our qualitative standards do we move on to quantitative analysis to determine the estimated intrinsic value.
What makes a high-quality company?
The best companies, i.e. franchises, consistently earn high returns on capital. A franchise is a company that provides a product or service that 1. is needed or desired (demand), 2. customers think or believe has no close substitute (moat) and, 3. pricing is not subject to regulation (pricing power).
These characteristics provide the ability to price a product or service above the company’s cost of capital, and therefore earn excess returns. Economic theory suggests competition would lower excess returns, however possessing all three of these qualities can protect against competition. Alternatively, a commoditized business only earns high returns on capital if it is a low-cost operator or if supply for its product/service becomes tight, allowing the firm to raise prices. Inevitably, competition increases, tight supply ends, and excess returns on capital disappear.
For example, the five largest U.S. companies by market cap- Apple, Google, Microsoft, Amazon, and Facebook- essentially require no capital to operate. In certain parts of their businesses they have the three franchise qualities, providing them a moat and the ability to earn high returns on the nominal capital invested. That said, a strong business only becomes a strong investment at the right price.
While there may be several different types of moats, they essentially come down to one important variable, barriers to entry. In his book, Competition Demystified, Bruce Greenwald does a great job defining a barrier to entry as an incumbent firm’s ability to do what potential rivals cannot. It boils down to three key advantages:
1. Demand: Customer captivity either from customer habit, switching costs, or search costs.
2. Supply: Ability to supply products at a lower cost than competitors such as through proprietary technology, experience, supplier agreements, etc.
3. Economies of Scale: Ability to reduce costs per unit as volume increases, spreading fixed costs over a greater number of units sold.
A company usually falls somewhere in between a franchise and a commoditized business. Moats are constantly under attack and the competitive environment often shifts as technology changes. What once looked like a franchise such as local television broadcasters and newspapers, can quickly look more like a commodity type business.
Management plays a crucial role in protecting and growing a company’s moat and is a significant consideration in any investment. We look for management with a proven track record of operating the business and making good capital allocation decisions. Fortune 500 founder-led companies have tended to outperform, potentially reflecting the founder’s entrepreneurial drive and an owner’s mentality. Management is often more incentivized to grow the company at the expense of shareholders. We prefer companies with CEOs who have significant equity stakes in the business, or better yet companies that were actually founded by current management.
Top two positions
While we have discussed our investment philosophy in detail throughout past letters, we thought it might be useful to provide more color on specific holdings in the portfolio. It would obviously be easier and less time consuming to quietly manage the portfolio behind closed doors and investors just receive their monthly statements, but we want to provide a higher level of understanding and transparency. Even though many of our current investors are close friends and family who entrusted us with their hard-earned capital because of our past relationship, we want to discuss what we would want to know if we gave our money to an investment manager. Below we discuss our investment in Platform Specialty Products (PAH) and Liberty Latin America Ltd. (LILAK). In future letters, we plan to continue more detailed discussions of relevant investments and portfolio decisions.
We hope you found this quarterly update helpful in understanding your portfolio and look forward to seeing all who will be attending our annual luncheon. If you have any questions or comments please reach out, we are always happy to hear from you.
Sincerely,
Saga Partners
Joe Frankenfield, CFA
Michael Nowacki
Platform Specialty Products Corp. (PAH) – Avg. purchase price $9.92
We have owned PAH since the portfolio’s inception. Shares increased quickly in early 2017 on rumors of a sale of their Agricultural Solutions segment (Ag segment), only to fall back to pre-rumor prices once the sale fell through in August. We added to the position in late 2018 as underlying fundamentals improved, shares remained essentially flat, and a corporate catalyst emerged.
PAH started as a special purpose acquisition company or “SPAC” in 2013, to acquire and consolidate specialty chemical companies that are “asset light” and “high touch,” meaning high return on capital, sticky businesses. PAH made eight acquisitions since 2013, issuing equity, leveraging the balance sheet, and arguably overpaying for a few companies prior to an industry cyclical decline.
The prior CEO, Dan Leever, came from PAH’s first acquisition- MacDermid. He was successful in growing MacDermid since 1990, however apparently had difficulty in consolidating the recently acquired international operations and left PAH at the end of 2015. A combination of top management leaving, two quarters of missed guidance, and the market’s realization that leverage can work both ways, caused shares to fall nearly 80%, from a high of $28 on June 2015 to a low of $6 in February 2016. While there were several missteps, PAH consists of quality businesses that are simply burdened by a leveraged balance sheet.
The Performance Solutions segment, made up of MacDermid, Alent, and OMG, manufactures specialty chemicals that focus on surface treatment and electronic assembly. The business is part of multi-step processes with tight customer relationships, generally tailored to meet specific customer requirements. The products typically represent a small proportion of total end material costs but play an essential role, providing potential pricing power, stickiness of products, and subsequently higher margins.
The Agricultural Solutions segment is the world’s 10th largest player in agrochemicals consisting of Arista Lifescience, Chemtura, and Agriphar. It provides herbicides, insecticides, fungicides, seed treatment, and other products to the agricultural landscape that enhance crop and yield quality. They are a formulation-based ag company, focusing on niche crops, thereby avoiding head-to-head competition with the big players like Monsanto and DowDupont. In recent years this segment has faced industry headwinds from excess inventories, as well as unfavorable foreign currency translation. It can be a seasonal business subject to weather conditions, but overall PAH has a global reach and broad product mix, which combined with a strong distribution channel helps differentiate it from potential competitors serving these niche markets.
Once shares were in a freefall in late 2015 and early 2016, PAH started to look like a more attractive investment opportunity. The current CEO, Rakesh Sachdev, started in early 2016. He was previously CEO of Sigma-Aldrich Corporation, a specialty chemical company based in St. Louis, Missouri. Sigma-Aldrich was a similarly sized company with $2.8B in sales and ~$700M in operating income. During his 10-year tenure at Sigma-Aldrich, he grew sales mid-single digits and earnings per share high-single digits, ultimately selling the company to Merck KGaA in 2015 for $17 billion at a 20x EBITDA multiple.
Since Rakesh became CEO of PAH, he suspended additional acquisitions and refocused the company on consolidating the large disparate operating companies. In his first year, negative trends reversed with organic sales increasing mid-single digits and adjusted EBITDA up high single digits. PAH streamlined their capital structure by refinancing $4 billion in high rate debt that ultimately saves the company $20 million in annual interest expense.
Despite solid underlying operating improvements and a more sanguine outlook, the share price remains essentially flat year-over-year. With $5 billion in net debt and $821 million in adj. EBITDA (6x net debt/EBITDA), the depressed share price likely reflects the more leveraged balance sheet. Although cash flow leverage looks worse when compared to unadjusted EBITDA of $407 million or free cash flow of $144 million, investor concern likely is focused on the $1.4 billion bond due in 2020 and subsequent debt maturities throughout 2021-2023.
In August 2017, PAH abandoned the sale of the Ag segment after offers were below management’s valuation expectations of $4.5 billion, or ~12x 2017 Ag segment EBITDA. Management subsequently announced the intention to split the two segments in mid-2018 through an IPO of the Ag segment with proceeds going towards debt reduction, providing a more manageable leverage profile (3.5x for Ag segment, and 4.0x-4.5x for Performance Solutions segment within 12-18 months of the IPO).
This potential catalyst presents an interesting opportunity if management can receive a fair IPO valuation for the Ag segment. Simply issuing shares at a higher valuation than the company is currently trading will increase the per share market value of the company. For example, imagine a hypothetical company with 100 shares outstanding, selling for 0.5x intrinsic value and a $1 share price. Now imagine the company can issue shares in the open market at 1x intrinsic value or a price of $2. If 50 shares were issued at 1x intrinsic value ($2 per share), proceeds of $100 would provide a total market value of $200. With 150 diluted shares outstanding and $200 in market value, shares would sell for $1.33, or a 33% per share increase.
The question is what price the Ag segment will receive in an IPO. We expect that if PAH had a more moderate leverage profile it would trade in line with peers. Management appears determined to only issue shares in an IPO if the Ag segment receives what they believe is a fair valuation, likely ~12x EBITDA. The higher the valuation and resulting proceeds, the lower the equity dilution, and subsequently greater market valuation per share.
Assuming each segment reaches management’s leverage goals with IPO proceeds, cash flow leverage of 4.5x in Performance Solutions and 3.5x in Ag segment, PAH’s total net debt post-IPO will be $3.5 billion based on 2018E EBITDA consensus expectations. With current net debt of $5 billion, PAH will need to raise ~$1.5B through the Ag segment IPO.

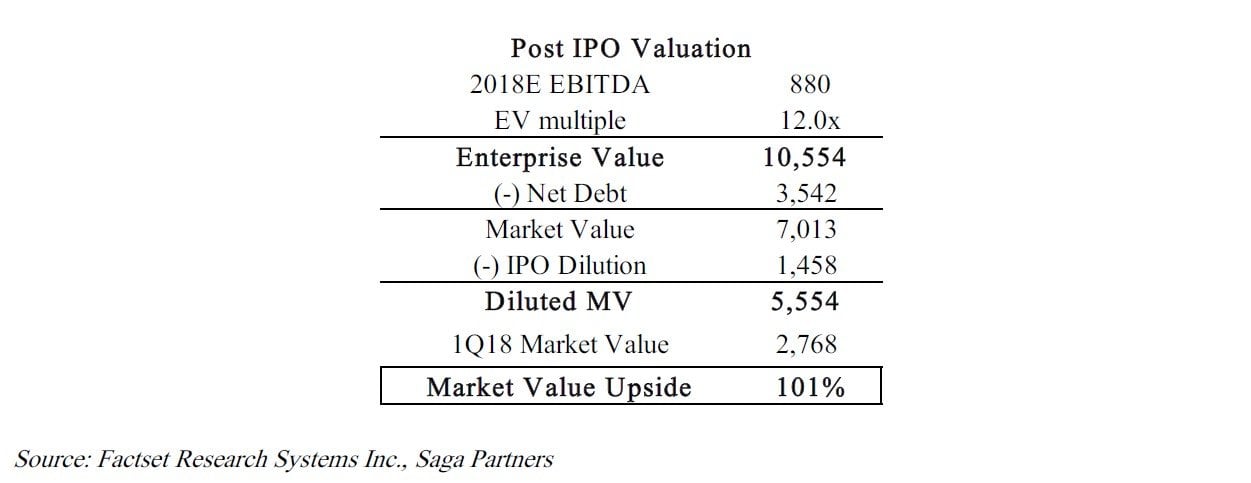
While we take adjusted EBITDA figures with a grain of salt, subject to discretionary management add-backs, we think it helps approximate earning power for PAH and provide a rough proxy for valuation. PAH is trading at an enterprise value of $7.9 billion, or 8.8x 2018E adj. EBITDA. Industry peers, both ag and specialty chemical companies, currently trade between 11x-14x EBITDA. A 12x EV/EBITDA multiple is very reasonable for a more moderately leveraged PAH with high-quality operations, expecting high-single digit operating income growth over the intermediate term. This would provide an enterprise value of $10.6 billion. Subtracting post IPO net debt of $3.5 billion, and assumed $1.5 billion in dilution from shares issued, provides an equity market value of $5.6 billion, or over ~$19/share- twice the current share price.
PAH’s current leverage profile is the primary risk, however it is supported by a high quality, high margin, sticky business. The new CEO has a strong track record and there are signs of improving industry and company fundamentals. With shares trading at nearly half the value of peers and a pending corporate catalyst that could unlock value in the near-term, we believe shares offer a very attractive investment opportunity.
Liberty Latin America Ltd. (LILAK) – Avg. purchase price $21.02
LILAK is another situation where a series of events have led to a substantial decline in shares, providing a very favorable price to value relationship.
Cable companies serve as the infrastructure that connect households across the country. Their services have evolved from merely linking remote towns to tv broadcasters in the 1950’s to offering pay TV, telephone services, and high-speed internet in present day.
The economics of cable operators can have monopolistic utility-like characteristics. Once the large upfront investment in cable and wiring is built, maintenance costs are fairly nominal and the high costs of building an overlapping network keeps competitors away.
Spreading the large fixed costs across many subscribers benefits companies with scale and creates a high barrier to entry. As a cable operator increases its share of total telecom spending in a certain area, it can increasingly outspend smaller competitors on network maintenance and upgrades while gaining operating cost efficiencies. In other words, being the incumbent cable operator is a big advantage. Most subscribers view cable services as essential parts of everyday life providing fairly recession resistant, contractually recurring cash flows, with modest pricing power, and limited competition in the areas served.
In the United States, most households only have one cable provider choice, now likely either Comcast, Charter Communications, or Time Warner. However in recent years the large wireless telephone companies, AT&T and Verizon, have tried to compete by laying fiber in their own networks or acquiring cable assets with varying degrees of success. Eventually we expect further fixed-mobile convergence between the wireless and cable providers, where one company will provide a seamless transition between mobile and fixed broadband connections.
All else being equal, we believe cable operators have an advantage over wireless companies because of their built out fixed line infrastructure of fiber and coax cable systems compared to the slower cellular networks. Around 75% of internet traffic travels over Wi-Fi. While cable is potentially threatened by “cord cutting” and declining pay TV trends, increasing demand for faster and greater internet capacity only increases the demand for cable services.
With that background on the cable industry, we can now dig into the real topic at hand. LILAK is a wireless and cable operator in Latin America and the Caribbean. It came about through a series of transactions tied to Liberty Global (Liberty), the largest European cable operator, and its Chairman John Malone, a high-profile cable exec and investor.
In July 2015, Liberty created a tracking stock for its Latin American operations in Chile and Puerto Rico in an effort to create a pure play cable stock for the region. A tracking stock represents the shareholder’s interest in a particular division of a company without actually having claim on the assets. The purpose is to separate the segment’s performance for shareholders while the parent company can maintain control, provide certain operating functions, and potentially prepare for a hard spin off of the segment.
LILAK shares started trading above $40 but a series of events in the latter half of 2016 led to over a 50% decline in price. In June 2016, LILAK closed the $8.1 billion acquisition of Cable & Wireless Communications (C&W), a Caribbean telecom provider that more than doubled LILAK’s sales. C&W was purchased for a fairly high valuation of 12x EBITDA which only a year earlier closed on a $2.7 billion acquisition of Columbus International for nearly 13x EBITDA. The successive transactions were largely motivated by John Malone who originally had an investment in Columbus International that was rolled into C&W and what now equals ~6% ownership of LILAK.
Shortly after C&W closed in June 2016, roughly two thirds of LILAK’s float was spun off to Liberty shareholders leading to selling pressure from investors not interested in their nominal ownership in a company 1/10th the size of the Liberty Global parent company. Additionally, a combination of Hurricane Matthew in the Bahamas and somewhat aggressive legacy C&W accounting led to two quarters of missed results and lowered expectations leading to a further decline in shares. Fast forward one year to 3Q17 and LILAK was once again hit by an active hurricane season with Hurricanes Irma and Maria severely damaging Puerto Rico and other Caribbean regions, further pressuring shares.
Despite somewhat softer fundamentals and weather-related problems, one of the biggest risks with LILAK in our opinion was the misuse of shareholder capital to pay for the C&W acquisition at an expensive valuation. We think the transaction was heavily influenced by John Malone who directly benefited from the high purchase price. Despite the prior conflicts of interest, John Malone now owns a ~6% ($130 million) interest in LILAK, while a relatively small portion of his estimated $8 billion net worth, still not a small sum and worth more than his 2% stake in Liberty Global. Additionally, Malone does not own any other Latin or Caribbean cable assets, therefore aligning his interests with current LILAK shareholders.
In most of its markets LILAK has dominant market share and offers faster broadband speeds than its competitors which should help drive subscriber growth. For example Digicel, a wireless mobile provider and C&W’s primary competitor throughout the Caribbean, has aggressively invested in building out its fixed network in an effort to gain market share by offering bundled services. While C&W’s current results have been negatively impacted by increased competition, Digicel has over leveraged its balance sheet to the point where further investments are unlikely and their fiber assets still pale in comparison to C&W’s. With Digicel’s hands tied behind its back and still dependent on purchasing network capacity wholesale from C&W, LILAK is strongly positioned to benefit from a weakened competitor going forward.
At the beginning of 2018, shares were fully spun out of the Liberty parent into a completely separate legal entity, providing more clarity to LILAK’s fundamentals. From a valuation perspective, management guided 2018 operating cash flow (adj. EBITDA) to be greater than $1.4 billion. Given Latin America’s and Caribbean’s low fixed broadband penetration rates (~35%-40% vs. 85%-90% in the U.S. and Europe), and recent broadband growth rate trends (5-year CAGR of ~7%), management expects organic EBITDA growth in the high single digits.
There are few publicly traded industry peers in Latin America, therefore U.S. and European comparisons are used as a valuation benchmark. Cable/broadband operators such as Comcast, Charter Communications, Liberty Global, Altice, and Cable One trade at EV/EBITDA multiples of 9x-10x. Wireless telecom peers such as Verizon, AT&T, Sprint, and T-mobile trade at a 6x-7x multiple, however U.S. wireless companies compete in more saturated markets and have a lower growth outlook, therefore deserve lower multiples.
LILAK generates ~60% of sales from cable/broadband assets and ~40% from wireless segments. Based on publicly traded peer multiples, an approximate fair value blended EV/EBITDA multiple is ~8x. While one could argue that LILAK operates in higher growth, more fragmented regions and deserves a higher multiple, it also competes in less economically stable regions exposed to foreign exchange risks.
LILAK’s 2018 consensus EBITDA of $1.4 billion is at the bottom of management’s guidance of “at least $1.4 billion”, providing a 2018 EV/EBITDA of 6.3x. Note consensus estimates may be conservative since guidance incorporates the fact Puerto Rico and Caribbean regions are still recovering from hurricane impacts. Additionally, 2017’s original EBITDA guidance was $1.5 billion, likely a better reflection of LILAK’s earning power. However, applying an 8x multiple to 2018E consensus EBITDA provides an enterprise value of $11.4 billion, less net debt of $5.8 billion, provides a market capitalization of $5.6 billion, or $33/share, over a 70% premium to the $19 share price at the end of the first quarter.
LILAK offers a compelling investment in a company with high barriers to entry, positioned favorably in the regions it competes. It has the potential to grow high single digits organically as broadband penetration rates increase throughout the region, with opportunities for acquisitions in the more fragmented Latin American markets. John Malone is now aligned with shareholders and future dilutive acquisitions are less likely. Shares were negatively impacted by the spin off and hurricane disruptions, now selling at a steep discount to potential earning power. We like LILAK’s long-term prospects and view it as a high-quality business with strong growth potential, selling for a very attractive valuation.


