
Excerpted from McIntyre Partnerships Q42017/Q1 2017 letter to investors
By Chris McIntyre
Looking for more top emerging managers and small cap ideas check out Hidden ValueStocks

I hope you all are having a pleasant start to spring. Before I begin, I want to explain why I am combining our Q4 2017 and Q1 2018 letters. I had originally planned to send out the Q4 letter in mid-February, but as I began writing, the S&P 500 fell 7% in two days and the volatility index (VIX) went from 13 to 33 (Whoa!). Given the turbulence, I decided my time was better spent searching for new ideas and that, as a recently launched long-biased fund, the letter should address the selloff. As the month progressed and markets remained choppy, I decided to save time and merge the two. The Q4 and 2017 reviews are attached at the end of the letter.
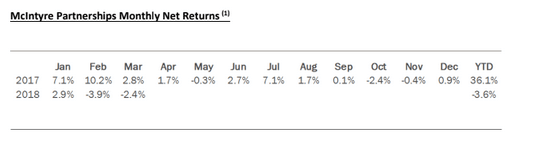
McIntyre Partnerships Monthly Net Returns (1)
Performance Review – Q1 2018
Through March, McIntyre Partnerships returned -3.2% gross and -3.6% net. This compares to S&P 500 and S&P 600 returns including dividends of -1.2% and 0.6%, respectively. During the quarter, the fund underperformed by ~200-400bps.
Year to date, our performance is lousy. As always, I do not consider three-month performance relevant for our concentrated portfolio, but it has been a frustrating start to the year nonetheless. Rather than any spectacularly poor individual stock performances, the YTD performance has been characterized by a slow trickle downward.
The biggest drag on YTD performance is our CBS investment, which fell ~20% in the quarter and contributed ~200bps to our loss. Despite the mark-to-market loss, I remain quite bullish on CBS and have significantly increased our investment. CBS is discussed further later in the letter. LILAK, the fund’s largest single holding, fell 5% and contributed ~100-150bps. Our only other greater-than-100bps loser is CDR, which lost ~110bps. As discussed below, CDR is the only position where I believe my reasoning is now incorrect, and the position has been reduced to sub-100bps of exposure.
Our only significant YTD winner is DDS, which contributed ~150bps.
Portfolio Review – Exposures and Concentration
As of March end, our exposures are 109% long, 9% short, and 100% net. Our five largest positions were 74% gross exposure and our ten largest were 97%.
Our five largest positions are LILAK, CBS/DISCA, our small-cap financials basket, Telesites, and STZ.
~56% of the portfolio is what I would consider a non-cyclical business (cable, beer, cell towers, etc.). ~47% of the portfolio has a “hard catalyst” (spinoff, merger, asset sale, etc.) anticipated in the next 12 months, while another ~33% have “soft catalysts” (earnings beats, price increases, etc.).
Portfolio Review – Existing Positions
CBS
Despite the fall, CBS remains one of my top investment ideas. I believe the stock’s Q1 fall was largely due to investor sentiment regarding a merger with Viacom, rather than a change in CBS fundamentals. It’s worth noting that CBS (and VIA as well) reported strong quarterly results and rising EPS estimates. In January, news broke that CBS and VIA were considering a merger. Despite the business logic and significant potential synergies, shares fell ~20%, a significant divergence from the rest of the media sector, which was largely flat in Q1.
The shift in sentiment is due to VIA’s exposure to legacy pay-TV subscriber declines. However, I significantly disagree with the bearish sentiment regarding the transaction. Foremost, I believe CBS is a premier asset in media, with best-in-class management, strong strategic positioning, and accelerating subscriber growth, which should warrant a premium multiple on a standalone basis. The fear is that by merging with VIA, shareholders are now more exposed to legacy pay-TV subscriber losses. However, this fear misses the most important detail of any stock investment: the price at which it occurs. VIA is likely to be acquired at ~4-5x EV/EBITDA including synergies and hidden assets, which implies CBS is trading at ~6.5x my pro-forma 2019 EPS estimates, with ~$7-$15/sh in “hidden assets.” The valuation discount becomes even more extreme if one assumes buybacks at the current share price: CBS trades ~3-4x my 2022 EPS estimate in this case. Even if VIA is broken and heading towards zero, I believe a >10% decline rate would be required for the transaction to be value destructive. VIA grew network sales 1% last quarter.
This substantial valuation discount, particularly on outer year earnings, provides a strong margin of safety for our investment. As a theoretical example, if one assumes CBS will trade at the current forward market multiple (~16x), a flat share price would imply CBS misses my 2022 EPS estimates by ~75%. Put bluntly, I believe either my estimates will prove exceptionally wrong or our investment has little risk of long-term loss of capital. Further, CBS offers substantial upside if my reasoning is correct.
We maintain a substantial position.
CDR
Entering the year, we had a modest-sized position in CDR. My reasoning was that CDR traded at an attractive ~8.5% cap rate and levered FCF yield of ~12%, comparable private transactions implied a liquidation value 30% higher, and CDR would return to growth in 2018. Unfortunately, a combination of macro and CDR-specific issues have weighed on the stock YTD. In Q1, long-term US rates crept upwards, and real estate broadly has fallen ~10% YTD in response, with retail real estate being the worst
performing real estate sector, down ~20% YTD. (So much for sentiment being washed out….) Making matters worse, CDR also modestly missed my estimates for 2018 guidance.
While I remain favorably inclined on select retail real estate, I now believe I was mistaken in my assessment of the long-term asset quality in CDR’s portfolio and I have been disappointed in their capital allocation plans.
I have substantially reduced our CDR position and rotated our position into another retail REIT (DDR) which I believe has better assets and a solid plan to narrow the gap between public and private market retail real estate valuations. DDR is discussed further below.
DDS
I substantially reduced our DDS position during Q1. Retail has broadly rallied in Q1 and DDS posted better than expected Q4 sales and earnings. While I remain interested in DDS long-term story, shares have rallied ~40% YTD. I am open to reinitiating a DDS position at a lower price and/or if management articulates a real estate development plan.
Small-Cap Financials Basket
Previously, I have referred to this as our REIT basket. However, I have renamed it our “Small-Cap Financials Basket,” as it has significant exposure to non-real estate investments. Our goals for the basket remain the same: 15-20% IRRs with minimal market correlation, primarily achieved through underlevered financial or real estate assets trading at discounts to liquidation value.
The current constituents are Sandown Capital (SDC SJ), RDI, and ORM. SDJ and RDI are discussed below.
Portfolio Review – New Positions
SDC is a thinly-traded recent spin where the classic smaller-cap spin from larger entity has created a favorable entry point. SDC is a “permanent capital vehicle,” i.e., effectively a holding company/closed-end fund model, which owns a portfolio of modest-risk securities trading at a 30% discount to NAV with minimal leverage. I believe shares offer an attractive investment where we stand to lose little if wrong and to make a great deal if correct.
SDC’s parent company is Peregrine Group, the oldest hedge fund management company in South Africa.
In mid-2017, Peregrine decided to spin out its excess cash and securities portfolio to create a permanent capital vehicle. Peregrine’s reasoning was two-fold: the mark-to-market of the securities portfolio added unnecessary volatility to Peregrine’s earnings, and insiders wanted a higher rate of return on their investments. It’s worth noting Peregrine insiders are significant shareholders. Due to the smaller spinoff from larger-cap company dynamic, along with the general lack of coverage in South African small caps, SDC is currently trading at a 30% discount to its NAV.
Given the sizeable discount to NAV, the investment hinges on 1) NAV accuracy and 2) SDC’s investment returns outlook. On NAV accuracy, the portfolio consists of diversified European real estate investments, particularly Stenprop REIT (STP SJ), and investments in Peregrine’s funds, particularly long/short equity,
fixed income, and global macro. The funds are in generally easily-marked securities and Peregrine has a strong reputation as an honest, high-quality investment manager. On return outlook, the vehicle is managed by Peregrine’s founder, Sean Melnick, under a reasonable management contract targeting a greater than 15% rate of return, which compares to the South Africa prime rate of ~10%. Sean Melnick is a well-known entrepreneur and investor in South Africa. While he could prove a bad capital allocator, the substantial discount implies limited fundamental long-term risk (down 30% is really, really bad investment performance…) and he historically has been a capable manager.
I believe the combination of a recent spinoff, low leverage, and steep discount to NAV creates an attractive entry point. Assuming a 10% IRR on SDC's investment portfolio (below the management company's hurdle) and an exit at 0.9x NAV in one year, shares offer >50% upside (~Rs 5.50/share exit).
Portfolio Review – New Positions
Sandown Capital (SDC SJ)
SDC is a thinly-traded recent spin where the classic smaller-cap spin from larger entity has created a favorable entry point. SDC is a “permanent capital vehicle,” i.e., effectively a holding company/closed-end fund model, which owns a portfolio of modest-risk securities trading at a 30% discount to NAV with minimal leverage. I believe shares offer an attractive investment where we stand to lose little if wrong and to make a great deal if correct.
SDC’s parent company is Peregrine Group, the oldest hedge fund management company in South Africa.
In mid-2017, Peregrine decided to spin out its excess cash and securities portfolio to create a permanent capital vehicle. Peregrine’s reasoning was two-fold: the mark-to-market of the securities portfolio added unnecessary volatility to Peregrine’s earnings, and insiders wanted a higher rate of return on their investments. It’s worth noting Peregrine insiders are significant shareholders. Due to the smaller spinoff from larger-cap company dynamic, along with the general lack of coverage in South African small caps, SDC is currently trading at a 30% discount to its NAV.
Given the sizeable discount to NAV, the investment hinges on 1) NAV accuracy and 2) SDC’s investment returns outlook. On NAV accuracy, the portfolio consists of diversified European real estate investments, particularly Stenprop REIT (STP SJ), and investments in Peregrine’s funds, particularly long/short equity,
3
fixed income, and global macro. The funds are in generally easily-marked securities and Peregrine has a strong reputation as an honest, high-quality investment manager. On return outlook, the vehicle is managed by Peregrine’s founder, Sean Melnick, under a reasonable management contract targeting a greater than 15% rate of return, which compares to the South Africa prime rate of ~10%. Sean Melnick is a well-known entrepreneur and investor in South Africa. While he could prove a bad capital allocator, the substantial discount implies limited fundamental long-term risk (down 30% is really, really bad investment performance…) and he historically has been a capable manager.
I believe the combination of a recent spinoff, low leverage, and steep discount to NAV creates an attractive entry point. Assuming a 10% IRR on SDC's investment portfolio (below the management company's hurdle) and an exit at 0.9x NAV in one year, shares offer >50% upside (~Rs 5.50/share exit).
A longer write-up of SDC SJ is available upon request.
Reading International (RDI)
RDI is an odd stock: a movie-theater operator with substantial real estate development assets. In general, I am attracted to investments with odd structures that make simplistic valuations difficult. Raucous trading pits do not exactly scream “nuance.” Specifically, I look for investments where I can identify a catalyst for the market to realize the discrepancy, and I believe RDI fits this bill.
Historically, RDI has been a family-controlled holding company focused on the development of movie theaters and their surrounding real estate in the US, Australia, and New Zealand. RDI is presently the 10th largest movie-theater operator in the US, and the 4th and 3rd largest in Australia and New Zealand, respectively. I view the movie-theater business as generally uninspiring but predictable. While the box office occasionally falls and the threat of digital innovation sometimes rears its head, theaters have been a predictable entertainment staple for many years. Slowly declining audiences have been offset with increasing ticket prices and improved customer experience, such as alcohol, 3D, better seating, etc. However, what makes RDI particularly interesting are its substantial real estate assets. In particular, RDI owns two “gem” Manhattan redevelopment opportunities: the old Tammany Hall on Union Square and City Cinemas 123, across from Bloomingdale’s. I believe these assets are being ascribed no value in RDI’s current share price, providing significant upside as the value is realized and, more importantly, substantial margin of safety if the theater business disappoints.
Valuing the theater business in-line with listed US/Asian peers (~8x 2018 EBITDA, 16-18x EPS) implies a valuation roughly inline with RDI’s current ~$16 share price. While valuing developmental real estate assets is challenging, I believe the assets are conservatively worth ~$5-$15 per share, ~30-100% of RDI’s current share price. As the assets are developed, I believe either RDI’s shares will reweight or the assets are likely to be spun off. Further, the controlling-family is currently having a “civil war,” with one member pursuing a legal challenge to force a sale of the company. I take no view on the likelihood of the court case, but I believe there are buyers interested if the court forces a sale. RDI has attracted hostile bids in the past.
DDR
As noted above, I remain selectively constructive on certain retail real estate, in particular good strip assets not tethered to the high rent PSF seen in malls. Further, publicly traded strip REITs trade at large

discounts to comparable private transaction. I believe DDR has high quality assets and a plan to close the private vs. public valuation gap: liquidating a third of assets and returning that cash to shareholders.
DDR is a strip REIT focused on high-quality “power centers.” For several years, DDR was a generally overlevered, underperforming REIT with a confusing portfolio and rotating door of C-suite execs (five CEOs in seven years). In Spring 2017, new management was (again) brought in. However, in a notable change, new management has previous real estate special situation experience, having previously sold Equity One to Regency. After a review, new management has been proactive. They have sold assets at a tighter cap rate than DDR trades, reduced debt, and, in December, decided to liquidate the lower-quality third of assets via a spinoff into a liquidating vehicle, which I believe will be a significant catalyst to realize shareholder value. I estimate the spinoff will be liquidated and return $3-$4 to shareholders in the next three years, roughly 45-65% of DDR’s current price. The remaining DDR assets will be a higher-quality, cleaner portfolio. Assuming a 7% cap rate yields ~$7 per share for the remaining company, roughly in line with DDR’s current price.
With ~50% of current share price to be returned in the next two to three years and the remaining company worth the current share price, I believe shares represent a strong risk/reward. However, DDR is excessively levered at 7-8x, inhibiting my willingness to make a large bet. DDR is a sub-5% position.
On the February Selloff and Portfolio Risk
While I do not plan to frequently comment on intra-month portfolio moves, I want to highlight the fund’s performance in the February selloff. For portfolio risk, as always, I target market-like volatility in rapid selloffs and substantial outperformance in prolonged downturns. During the February meltdown, our portfolio performance was inline with our targeted risk goals, falling at worst down ~4% on the year versus a peak of up ~6% in late January, which generally tracked the market’s fall.
As an investor, I am hyper-focused on risk. As Buffett says, the first rule of investing is don’t lose money. The second rule is don’t forget rule number one. We are a 100% net fund, which means we are always at short-term risk of a broad market selloff. While we are long-term focused, we operate in the public markets and need a strategy to handle the inevitable selloffs. We also need benchmarks to judge our performance. Our strategy is to have market-like volatility in a rapid selloff, and to have the fundamentals of our portfolio outperform in protracted declines, which combined will (hopefully) enable us to capitalize on others’ mistakes. Our benchmark for rapid declines is the overall market’s decline. By demonstrating our risk planning in real-time, my goal is to earn your trust and put the fund in a position to be greedy when others are fearful. While I am never thrilled by a decline (and certainly not by our YTD results), I am pleased that our performance in the selloff was within our previously established risk metrics.
As always, please feel free to contact me with any questions.
Sincerely,
Chris McIntyre (929) 399-5485
5
Through year end, McIntyre Partnerships returned 46.1% gross and 36.1% net. This compares to S&P 500 and S&P 600 returns including dividends of 21.8% and 13.2%, respectively. During the fourth quarter, the fund fell ~160bps on a gross basis, a significant underperformance of ~550-800bps in the quarter.
After a strong year, it is extremely frustrating to end with such a bad relative performance quarter. As I have written in every letter, I do not view three-month windows as relevant comparison periods for a benchmark of several hundred stocks versus our concentrated portfolio. However, that does not mean I am excited by the results. Large quarterly underperformances will inevitably happen but must be rarities if we are to have long-term success. Of note, our underperformance is less our absolute bad results (though they were hardly good) so much as the surge in the broader market, particularly tech and large-cap stocks. The reality is our concentrated portfolio of contrarian and less-cyclical businesses will have trouble keeping up with strong quarterly market advances.
Only two small winners contributed greater than 50bps to Q4 performance: DDS (~70bps) and STZ (~60bps). Similarly, we had only two significant losers: RLGY (~60bps) and LILAK (~320bps). RLGY is a mistake previously discussed in our Q3 letter. Our LILAK investment is discussed further below. Putting it together, we had one large loser, one “dragging my feet” mistake, and the rest of the portfolio market performed.
LILAK suffered two notable headwinds in Q4: the impact of Hurricane Maria on LILAK’s Puerto Rican subsidiary and a 10% price drop in December due to a large LILAK shareholder’s sudden decision to shutdown operations and liquidate. While a significant drag, at ~20% of capital, LILAK is also our largest position and even modest percent losses will have outsized impacts on the overall PNL. While I hate to lose 300bps on a position in a given quarter, an Act of God turning the power off to an entire US territory and a large shareholder surprise-liquidating with two weeks left in the year are among my better excuses for such a drag. At the end of the day, our PNL is heavily dependent upon the success of a handful of large positions, and their individual performance in a given quarter is a far larger driver of fund PNL than the broader indices, for better, or in this case, for worse.
Performance Review – FY 2017
During 2017, we had several notable large winners. Our biggest was CC, contributing approximately 1880bps to our overall PNL. However, five other investments contributed over 200bps: BLD (~480bps), RLGY (~320bps), LPX (~270bps), the CHTR complex (~250bps), and Telesites (~220bps). STZ and FSV both ~100-125bps each, while GLPI, QVCA, TWX, KLXI and DDS all added ~50-100bps each. Despite our poor Q4 performance, our 2017 losers were relatively limited: only LILAK (~80bps) and our market hedge (~100bps) were greater than 50bps losers.
Our performance was led by our largest investment. We entered the year with a 25-30% position in CC, which returned ~75% in Q1 and ~125% for FY2017. CC is an example of our contrarian/distressed strategy, where we will sometimes take very large positions in very out-of-favor segments with the goal of substantial outperformance. While I strive to find these as often as possible, extreme market dislocations are rare and we must simply bide our time waiting for them. Over the next decade, if I could find three of these investments I would be content. While these large opportunities will be significant determinants of our long-term results, their rarity means I think it makes sense to look at the portfolio
excluding CC to understand how our “bread and butter” investments worked. In this context, I am particularly pleased that our portfolio would have still beaten the S&P 500 and S&P 600 by 600bps and 1400bps, respectively, even without CC, while running at 70% net in a sharply upward tape. In a year with a significantly sized “home run” investment, I am particularly pleased that our bread and butter of five-to-eight event driven and GARP investments also outperformed.
(1) The Returns from January through August 2017 represent the performance results of a personal proprietary trading account managed by the Founder with a strategy similar to the strategy of the Fund. This information is presented for illustrative purposes only, the above results do not reflect the actual results of the Fund or the composition of its portfolio. From September 2017 onwards, returns are from the Fund. All returns are calculated using a 1.5% management fee, 20% incentive fee, and 5% hard hurdle.
This presentation is not an offer to sell securities of any investment fund or a solicitation of offers to buy any such securities. Securities of McIntyre Partnerships, LP (the “Fund” or “McIntyre Partnerships”) managed by McIntyre Capital Management, LP (the “Investment Manager” or “McIntyre Capital”) are offered to selected investors only by means of a complete offering memorandum and related subscription materials which contain significant additional information about the terms of an investment in the Fund (such documents, the “Offering Documents”). Any decision to invest must be based solely upon the information set forth in the Offering documents, regardless of any information investors may have been otherwise furnished, including this presentation.
An investment in any strategy, including the strategy described herein, involves a high degree of risk. There is no guarantee that the investment objective will be achieved. Past performance of these strategies is not necessarily indicative of future results. There is the possibility of loss and all investment involves risk including the loss of principal. Securities of the Fund are not registered with any regulatory authority, are offered pursuant to exemptions from such registration, and are subject to significant restrictions.
The information in this presentation was prepared by McIntyre Capital GP, LLC, the general partner of the Fund (the “General Partner”), and is believed by the General Partner to be reliable and has been obtained from public sources believed to be reliable. General Partner makes no representation as to the accuracy or completeness of such information. Opinions, estimates and projections in this presentation constitute the current judgment of General Partner and are subject to change without notice. Any projections, forecasts and estimates contained in this presentation are necessarily speculative in nature and are based upon certain assumptions. It can be expected that some or all of such assumptions will not materialize or will vary significantly from actual results. Accordingly, any projections are only estimates and actual results will differ and may vary substantially from the projections or estimates shown. This presentation is not intended as a recommendation to purchase or sell any commodity or security. The General Partner has no obligation to update, modify or amend this presentation or to otherwise notify a reader thereof in the event that any matter stated herein, or any opinion, projection, forecast or estimate set forth herein, changes or subsequently becomes inaccurate.
This presentation is strictly confidential and may not be reproduced or redistributed in whole or in part nor may its contents be disclosed to any other person without the express consent of the General Partner.


