Chain Reaction Research is a collaborative effort of:
Aidenvironment
Climate Advisers
Profundo
1320 19th Street NW, Suite 300
Washington, DC 20036
United States
www.chainreactionresearch.com
Authors:
Alexandra Christopoulou, Profundo
Tim Steinweg, Aidenvironment
Gabriel Thoumi, CFA, FRM, Climate Advisers
A segment of the palm oil industry continues to produce or purchase palm oil from recently deforested plantations and cleared peatlands. Actors in this segment contribute to the ‘leakage’ of unsustainable palm oil into the overall palm oil market. Leakage creates an unlevel playing field as the industry transforms into an accountable and sustainable business. One of the contributing factors is that palm oil refiners continue to source Crude Palm Oil (CPO) without placing meaningful sustainability criteria on the suppliers they source from. A November 2017 analysis by Chain Reaction Research (CRR) found that 26 percent of the palm oil refining capacity in Indonesia and Malaysia is not covered by No Deforestation, No Peat, No Exploitation (NDPE) sourcing commitments. In total, 52 company groups operate as ‘leakage’ refiners. Based on this list of non-NDPE palm oil refiners – or leakage refiners – the financiers of 16 companies servicing leakage markets are analyzed in this paper.
Key Findings
• Key financial institutions have provided USD 5.5 billion in equity and debt financing, and loans to fund 16 publicly-traded leakage refiners. These institutions hold USD 4 billion (out of USD 17 billion) in shareholder value, and control USD 1.5 billion in outstanding debt out of the USD 5.6 billion total. The remaining shares and debt are held by private investors and smaller financial institutions.
• 15 of the top-20 shareholders are international and five are Asian-based financial institutions. Among others, Commonwealth Bank of Australia, BNP Paribas, Vanguard, BlackRock, Dimensional Fund Advisors, the Norwegian Government Pension Fund, APG and Royal Bank of Canada hold shares in one or more leakage refiners.
• BNP Paribas’ position appears to contradict its own palm oil policy. BNP holds shares in Uni-President Enterprises, Sarawak Oil Palms and Emami Group. None of these groups have set up policies to avoid sourcing palm oil from companies that might violate BNP’s sustainability commitments.
• Leakage refiners are mainly debt-financed by local banks from their own country, with new loans declining. East Asian banks are the most important lenders, providing the majority of loans and underwriting. From 2013 to 2017, Japanese and Taiwanese banks provided 36 percent and 29 percent, respectively, of the total debt to the selected 16 refineries. From 2013 to 2017, the annual volume of new loans provided decreased by 92 percent, during which time the total outstanding debt decreased by 29 percent. This decrease might be due to positive free cash flows.
• Standard Chartered (SC) is one of the few lenders that has a palm oil policy. It expects palm oil refiners to develop a time-bound plan for RSPO certification and to maximize the use of RSPO-certified palm oil. SC currently funds Ruchi Soya Industries (USD 60 million), Tunas Baru Lampung (USD 6 million) and Uni-President Enterprises (USD 5 million).
Leakage Refiners Prevent A Market Transformation To Zero-Deforestation Palm Oil
NDPE Commitments Increase, But Leakage Refining Continues
Since 2013, key actors in the palm oil industry have taken increasing steps to address prevalent issues in this supply chain, such as deforestation, fires, peatland development and breaches of human rights. As reported by CRR in November 2017, this includes the adoption of NDPE sourcing policies by 74 percent of Indonesian and Malaysian refiners and 65 percent of the refinery market in the rest of the world. While many issues still persist on the ground, such commitments constitute an important step towards a more accountable and sustainable palm oil supply chain.
Meanwhile, a segment of the market continues to produce or purchase palm oil from recently deforested plantations and cleared peatlands. Actors in this segment contribute to the ‘leakage’ of unsustainable palm oil into the market. In this context, CRR defines leakage as ‘any activity in the palm oil industry, production, trade and/or consumption that is not subject to any NDPE policy requirements.’
Different Factors Contribute to Leakage
The different factors that contribute to the leakage market include:
• Palm oil refiners continue to source CPO without placing meaningful sustainability criteria on their suppliers.
• Recently adopted NDPE policies have not yet been fully implemented.
• The scope of policies is limited to subsidiaries over which a company group has managerial control.
• Growers hide or disassociate controversial assets from their clients, through transfer of assets to family members, disentangling them from corporate structures and using tax havens and secrecy jurisdictions.
• CPO mills source from third-party plantations. While their own plantation might comply with NDPE requirements, these third-party plantations might not.
• Large consumer markets may not demand sustainably produced products. For example, Indonesia, India, Pakistan and China do not require NDPE-compliant palm oil sourcing.
• Shareholders and debt (loans and bonds) financiers continue to finance participants that operate in the non-NDPE environment.
Financiers Enable Leakage Refiners
Data availability enables the analysis of the financial relationships for these 16 leakage refiners. These 16 leakager refiners were selected from a list of 52 leakage refiners previously identified by CRR (see Annex). Financial relationships regarding loans and underwriting services were analyzed over the five years from 2013 to 2017. Equity and bondholders identified refer to the most recent filing dates. The financiers of these 16 refiners are enabling the continuation of unsustainable production practices.
Furthermore, the paper provides insights in two ways:
• Financiers can see which leakage refiners they are financing.
• Forest 500 (Global Canopy Programme) policy scores of identified financiers then give their investors an insight into the non-NDPE compliance of financial institutions in their investment portfolio.
Most Equity and Debt in Leakage Refiners Held by International Investors
For the 16 companies analyzed, USD 17 billion in shares and USD 6 billion in total debt (2017) were identified in this research.
Shareholders: dominated by international investors
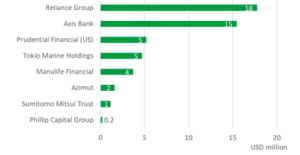
Figure 1 (below) shows the top-20 financial institutions holding shares of the selected 16 companies at the most recent filing date. A more detailed table with the refiners these financial institutions are investing in can be found in the Annex of this report. With a total value of USD 4 billion, these top-20 shareholders cover 68 percent of the total value of shares (USD 5.9 billion) identified as being held by financial institutions. The total value of shares is USD 17 billion, including holding from non-financial institutions like private investors.
Figure 1: Top-20 shareholders, most recent filing date
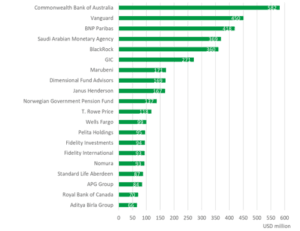
Source: Thomson Reuters
The top-20 shareholders identified are international, much less regional Asian-based financial institutions. Of the top-20 shareholders identified, 13 are scored on the Forest 500 (Figure 2). The majority of these financial institutions scored zero points (out of a maximum of five).
Figure 2: Forest 500 scores of top shareholders
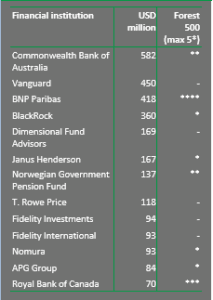
Source: Forest 500
A few scored one to two points, among them Commonwealth Bank of Australia (USD 582 million), the largest shareholder. The bank’s two points in the Forest 500 can be attributed to its environmental policy and climate change policy. However, no specific commitment to reducing deforestation is made by the bank. BNP Paribas, as the third largest shareholder (USD 418 million) scored four points and Royal Bank of Canada (USD 70 million) also scored three points. BNP Paribas scored well as it has a comprehensive palm oil policy covering both upstream and downstream palm oil companies and it applies to all of the bank’s offerings and entities. However, given the bank’s exposure to the identified companies in this report, it appears that it has not been effectively implemented by the bank. Royal Bank of Canada has neither any sector-specific policy nor does it commit to reduce deforestation, which raises a question on its three-point Forest 500 ranking.
Shareholders with low scores are US-based asset managers like Vanguard (USD 450 million), BlackRock (USD 360 million) and Dimensional Fund Advisors (USD 169 million). They are among the top-10 shareholders of leakage refiners. Also, European pension providers Government Pension Fund (Norway) and APG Group (Netherlands) invest significantly (USD 137 million and USD 84 million, respectively).
Bondholders: US, Japanese and Other International Lenders Dominate
Figure 3 (below) shows the financial institutions holding bonds of the selected 16 companies at the most recent filing date. The reported value of the bonds found is less than the value of shareholdings (Figure 1 above) as there are restrictions on the data availability, such as less transparency in bond fillings than share filings.
Figure 3: Bondholders, most recent filing date
Source: Bloomberg
From the bondholders identified, only Prudential Financial (US), Manulife Financial (Canada) and Sumitomo Mitsui Trust (Japan) are scored on the Forest 500 (Figure 4), all scoring low.
Figure 4: Forest 500 scores of bondholders
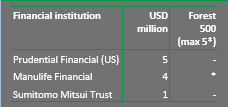
Source: Forest 500
Local Banks Finance Debt and Loans to Leakage Refiners
Historical Analysis 2013 to 2017
From 2013 to 2017, USD 4.1 billion were found in loans and underwriting services of bond and share issuances provided to the selected 16 companies. Of this total, currently USD 2.4 billion are outstanding, from which USD 1.5 billion are loans and USD 837 million are in bonds.
From 2013 to 2017, the annual volume of loans provided decreased by 92 percent, from USD 1.1 billion to USD 90 million. This drop is correlated to the decrease in the total outstanding debt: for the same period, the total debt of the 16 companies decreased by 29 percent to USD 5.6 billion (Figure 5). Bond and share issuances do not present a clear trend. The strong decline of total debt might be related to positive free cash flow and/or a decline in necessary financing of activities of these leakage refiners.
Figure 5: New loans, bond, and share issuances, 2013-17
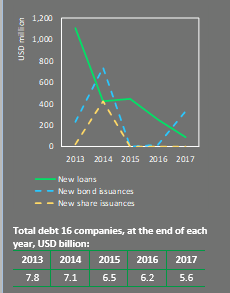
Source: Bloomberg, Thomson Reuters, Chain Reaction Research
Figure 6 (below) provides a breakdown between loans and underwriting services the individual companies attracted during the period from 2013 to 2017. For several of the examined companies, no loans and underwriting services could be identified. This could either be due to the fact they did not attract such financing during the analyzed period, or due to a lack of data availability.
Figure 6: Loans and underwriting provided, between 2013-17
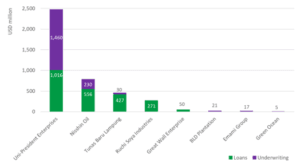
Source: Thomson Reuters, Bloomberg, Chain Reaction Research
Taiwanese Uni-President Enterprises dominates as it attracted total financing of approximately USD 2.5 billion between 2013 and 2017. Nisshin Oil and Tunas Baru Lampung follow with USD 786 million and USD 457 million, respectively. It should be noted that Uni-President Enterprises is also active in other activities besides palm oil.
Due to the different sizes of the companies analyzed, Figure 7 (below) shows the new financing each company attracted as a percentage of their total assets, cumulative at the end of each year. When viewing from a relative perspective instead of an absolute perspective, it can be seen that, in fact, Tunas Baru Lampung and Green Ocean attracted more financing than Uni-President Enterprises.
Figure 7: Percentage of loans and underwriting to total assets, 2013-17
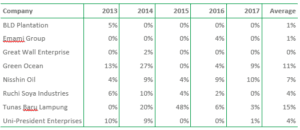
Source: Thomson Reuters, Bloomberg, Chain Reaction Research
Financial Institutions with Outstanding Loans and Bond Underwriting
After looking at the total amount of financing provided to the selected 16 companies from 2013 to 2017, the following analysis is focused on the currently outstanding loans and the underwriting of bonds that were issued during the same period.
Figure 8 (below) shows the top-20 financial institutions providing those loans and the underwriting of bonds. These top-20 account for 83 percent of this type of financing analyzed in this section.
Figure 8: Top-20 financial institutions provided financing between 2013-17, currently outstanding
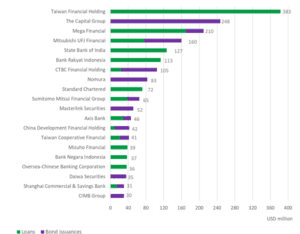
Source: Thomson Reuters, Bloomberg, Annual Reports, Chain Reaction Research
Figure 9: Top-20 financial institutions providing financing between 2013-17, currently outstanding, per company
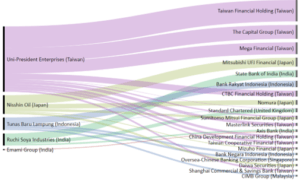
Source: Thomson Reuters, Bloomberg, Annual Reports, Chain Reaction Research
The analyzed leakage refiners are mainly being financed by local banks from their own country. The top-3 financiers (all from Taiwan) – Taiwan Financial Holding, The Capital Group and Mega Financial – together provided 36 percent of the total loans and bond underwritings obtained by all 16 companies. As can be seen from Figure 9 (above) and Figure 11 (below), financing provided by those top-3 financiers includes loans and underwriting of bonds provided to Uni-President Enterprises which, like its bankers, is also from Taiwan. Financing of Nisshin Oil (Japan) comes mainly from the Japanese financial institutions Mitsubishi UFJ Financial and Nomura (together providing 59 percent of Nisshin Oil’s loans and underwriting of bonds). State Bank of India is the main financier of Ruchi Soya Industries (India), providing 52 percent of its financing. Bank Rakyat Indonesia provides 51 percent of Indonesian-based Tunas Baru Lampung’s financing. From the top-20 creditors identified, eight are scored on the Forest 500. Most of them are scoring low, achieving zero to two points.
An exception is Standard Chartered, scoring four points as it has in place a specific commodity policy regarding palm oil that clearly states its expectations from producers, refiners, and traders of palm oil. However, it is important to note that the policy is applicable to new clients but does not take any outright action against existing clients that do not comply with the policy. Instead, the bank states that it will work closely with the noncompliant existing clients to improve their palm oil practices. Standard Chartered currently has outstanding financing to Ruchi Soya Industries (USD 60 million), Tunas Baru Lampung (USD 6 million) and Uni-President Enterprises (USD 5 million).
Financial Institutions from Japan and Taiwan Dominate
Financial institutions providing loans and underwriting services were grouped based on their region of origin (Figure 10 below).
Figure 10: New loans and underwriting services issued per year, per financial institution region
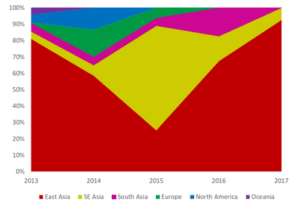
Source: Thomson Reuters, Bloomberg, Annual Reports, Chain Reaction Research
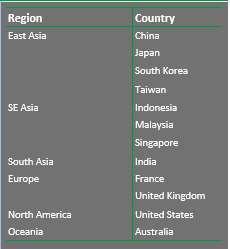
East Asian financiers dominated throughout the years, ranging between 25 percent at the lowest point (2015), and 93 percent at the highest point (2017). In 2015, financiers from South East Asia took over as the most important group, accounting for 64 percent of the total financing. From 2015 to 2017, financing from South East Asia declined as East Asian financiers took over again. South Asia played a smaller role overall, peaking in 2016 with 16 percent. European, North American and Oceanian financiers all played a much less important role than those from Asia. More specifically, Oceanian and North American financiers disappeared after 2015. Financiers from Europe contributed comparatively small shares between 2013 and 2016.
The high percentage of the East Asian financiers is due to the contribution of Japanese and Taiwanese financial institutions. Of the new loans and underwriting services provided to the selected 16 companies from 2013 to 2017, an annual average of 36 percent and 29 percent came from Japan and Taiwan, respectively.
Figure 11: Geographic location of key financiers
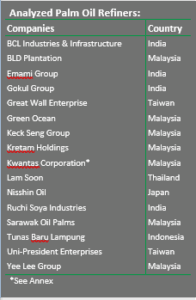
Annex: Chain Reaction Research’s 52 Leakage Refiners
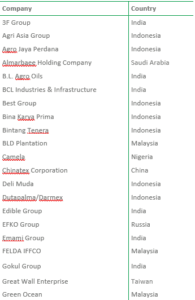
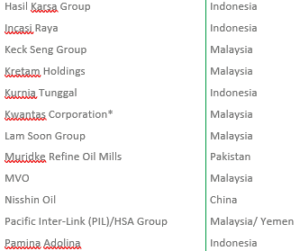
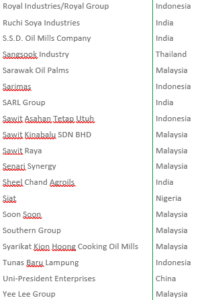
As part of the research for the Chain Reaction Research November 2017 report on refiners that are not compliant with NDPE requirements, CRR identified a total of 52 leakage refiners. These are listed in Figure 12 (below). For 16 of these refiners, financial relationships could be analyzed in more detail.
Figure 12: Full list of leakage refiners identified by Chain Reaction Research
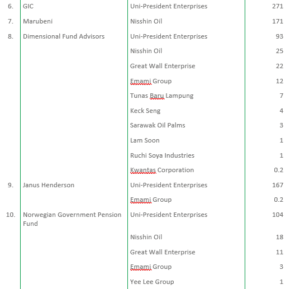
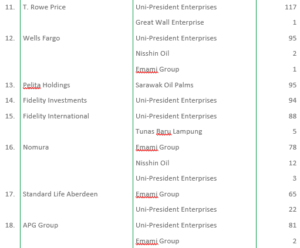
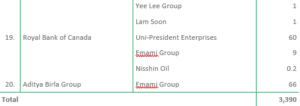
Shown in Figure 13 (below) are the Top 20 shareholders investing in the 16 companies analyzed in this research. Detailed breakdown per company is below.
Figure 13: Top 20 shareholders, per company, most recent filing date
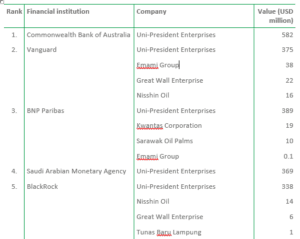
* During the process of this report production, Kwantas has published an NDPE policy.


