DoubleLine Asset Allocation webcast slides hosted by Jeffrey Gundlach.

Q1 hedge fund letters, conference, scoops etc, Also read Lear Capital: Financial Products You Should Avoid?
TAB I - U.S. Overview
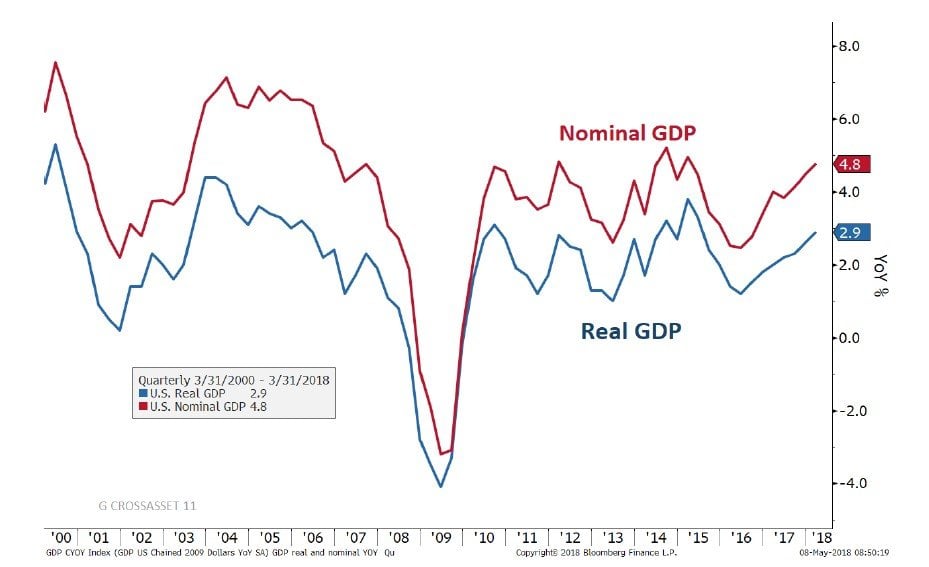
Gross Domestic Product – Real and Nominal
Source: Bloomberg
YoY ‐ year‐over‐year; GDP = Gross Domestic Product includes the total amount of goods and services produced within a given country. Nominal GDP is adjusted for inflation.
You cannot invest directly in an index.
U.S. Economic Expansions: Cumulative Real GDP
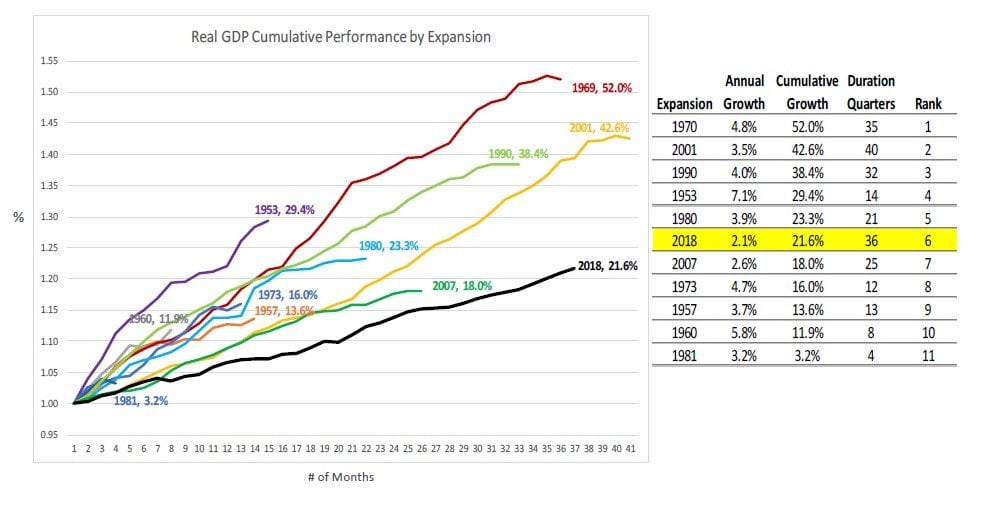
Source: Bloomberg, DoubleLine
GDP = Gross Domestic Product is the measure of goods and services with in a given country. NSA = Non‐Seasonally Adjusted, YoY= year‐over‐year.
You cannot invest directly in an index.
LEI (YoY) Heading into Recessions
Since January 1968
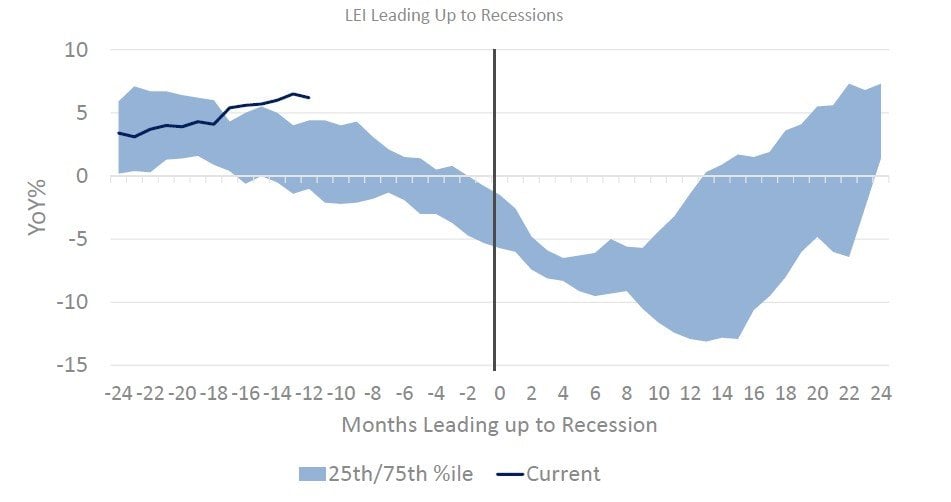
Source: Bloomberg, DoubleLine as of March 31, 2018
LEI = Leading Economic Indicators is a measurable economic factor that changes before the economy starts to follow a particular pattern or trend. YoY = year‐over‐year..
ISM PMI Leading Up to Recessions
December 31, 1947 to April 30, 2018
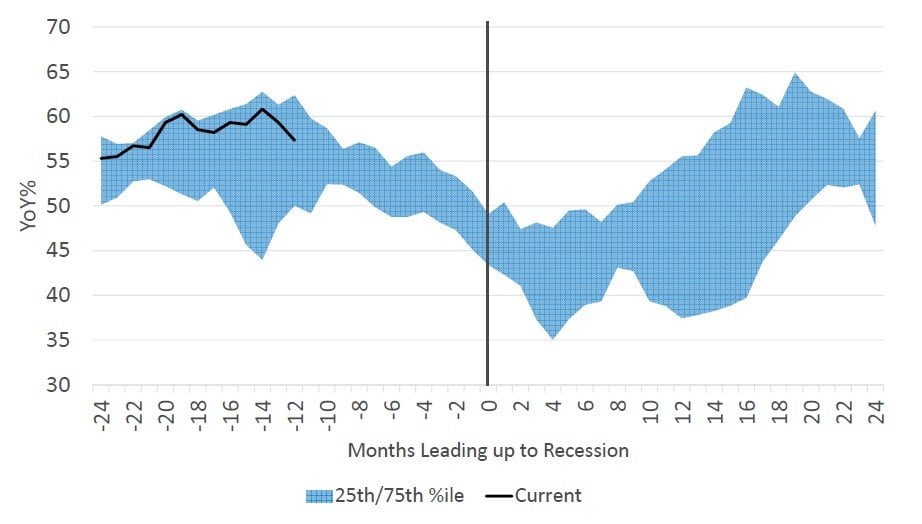
Source: Bloomberg, DoubleLine as of April 30, 2018
ISM = Institute of Supply Management. Purchase Manager’s Index (PMI) is an indicator of the economic health of the manufacturing sector and is based on: new orders, inventory levels, production, supplier deliveries and the employment environment. YoY = year‐over year. You cannot invest directly in an index.
U.S. High Yield Spread Heading into Recession
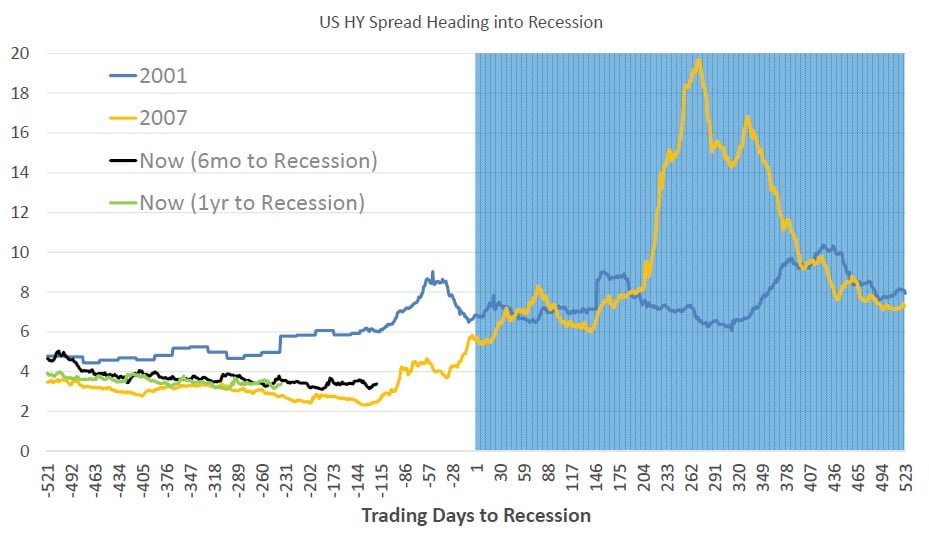
Source: Bloomberg, DoubleLine as of May 1, 2018
US HY = Moody’s Bond Indices Corporate BAA Index are an average of the daily values for the corresponding month and weekly values are averages for the daily yields of the corresponding week. Spread = the difference between the yields of two bonds with differing credit ratings. You cannot invest directly in an index.
Economic Surprise – Hard vs. Soft Data
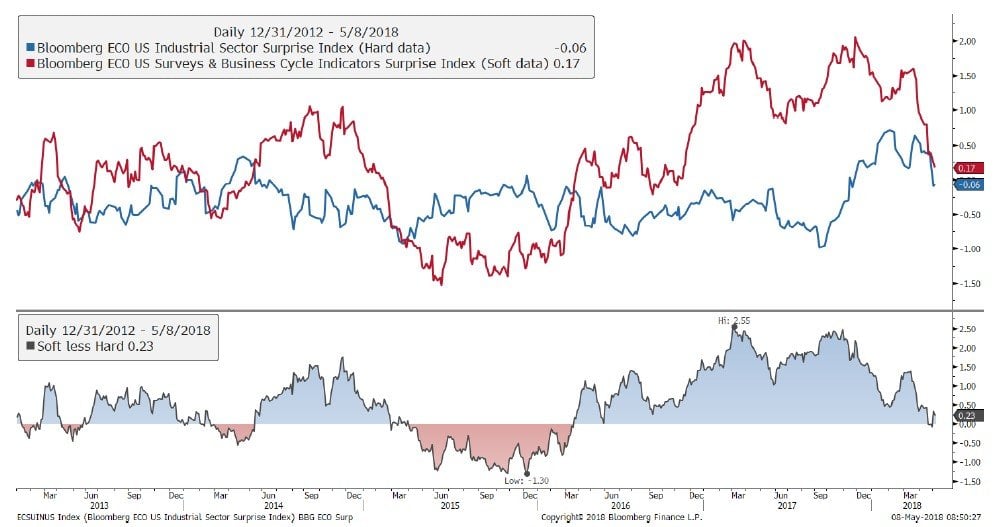
Source: Bloomberg, DoubleLine
The Bloomberg ECO Surprise Index shows the degree to which economic analysts under‐or‐over estimate the trends in the business cycle. The surprise is the percentage difference between analyst forecasts and the published value. Bloomberg ECO US Industrial Sector Surprise Index shows the degree of over and under estimation of the Industrial sector.
You cannot invest directly in an index.
U.S. Treasury 2s to 10s & Fed Hiking Cycles
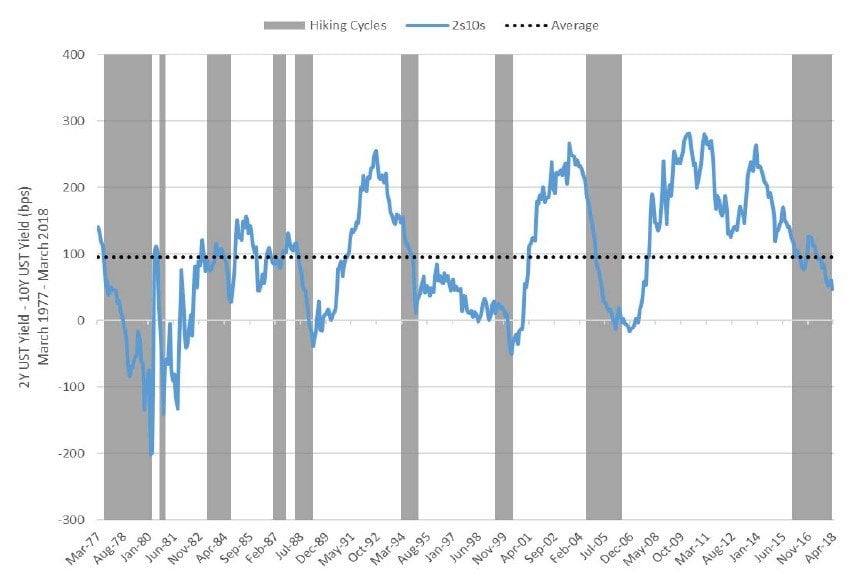
Source: Bloomberg Financial Services, DoubleLine Capital LP
2s to 10s ‐ U.S. 2 –year Treasury vs. 10‐year U.S. Treasury. GT10 ‐ US 10 Year Treasury Bond. GT02 ‐ 2year U.S. Treasury bond. You cannot invest directly in an index.
See the full PDF below.


