After 50 plus years (not a typo) as a sell-side analyst Richard X. Bove has moved to the buy-side as chief strategist at Hilton Capital management a division of Rafferty Holdings. While he does mention it, one can only wonder if Mifid 2 and the rise of the internet was a factor. As readers will no doubt acknowledge few want to pay $200,000 a year (from every single Bulge Bracket bank) to read why Apple is a buy. Regardless of the reasons, 50 years in the sell-side is a long career, ergo this is notable news. Readers can find a copy of an email which Bove sent to clients earlier this morning.
Bove sent a 67 page note to clients on the banking sector in the email we have not attached the report for legal and editorial reasons. However, we included a small excerpt on the topic.

Q1 hedge fund letters, conference, scoops etc, Also read Lear Capital:
From: Richard Bove <RREDACTED >
Date: Tue, May 8, 2018 at 9:13 AM
Subject: BuysideAs you know I have argued for years that the analysis of the banking industry has strayed from the critical factors that drive value in bank stocks. The concentration should be on hoarding capital and putting these funds to use in selling products and generating revenues and earnings. This type of analysis is common in virtually all other companies. However, banking analysis is now focused on buying back stock, interest rates, accounting, and government issues.
Therefore, from my point of view the time has come to put both theories to the test in the market. The approach that I favor has been in place at Hilton for slightly over three years. In that time frame the stocks that are owned have grown at the annual rate of 24% per year out performing bank stocks (XLF up 10.9%; BKX up 12.9%) overall and the S&P 500 (7.6%).
There are well over 100 bank stocks that meet my parameters. These companies are not operating passive strategies acting like liquidating trusts. They are attacking the markets very successfully buying other banks and building solid businesses.
Richard X. Bove
Hilton Capital Management
bove@ REDACTED
Tel: (516) REDACTED
Fax: (813) REDACTED
SUMMARY
We believe that the outlook for the banking industry is better than it has been in decades. Bank stocks are expected to benefit. We are committed to the view that there will be a positive revaluation of these companies driven by what could be a sustained period of increased earnings.
Defining the Environment
To support this view, this commentary will focus on four subjects. They are:
- Part One - Money flows in the economy;
- Part Two - An analysis of the banking industry;
- Part Three – A method of analyzing bank stocks; and
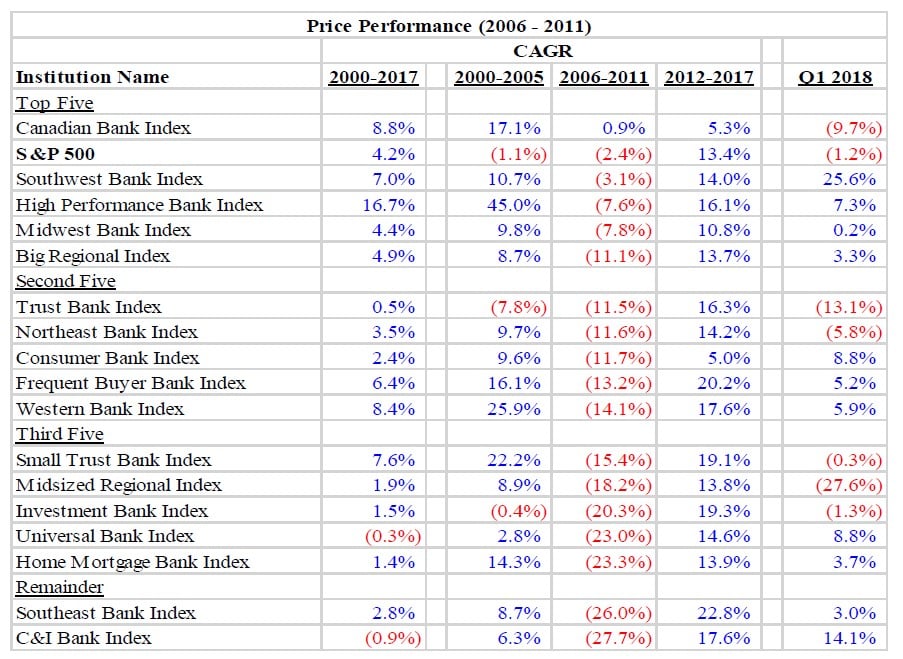
- Part Four – The analysis of 17 bank indexes through three economic cycles.
Money
The money discussion focuses on the profound change now underway in the structure of the U.S. financial system. After decades of unlimited availability at relatively low cost, money will be less accessible. Moreover, the cost of money is expected to rise meaningfully, not for a short period, but for decades.
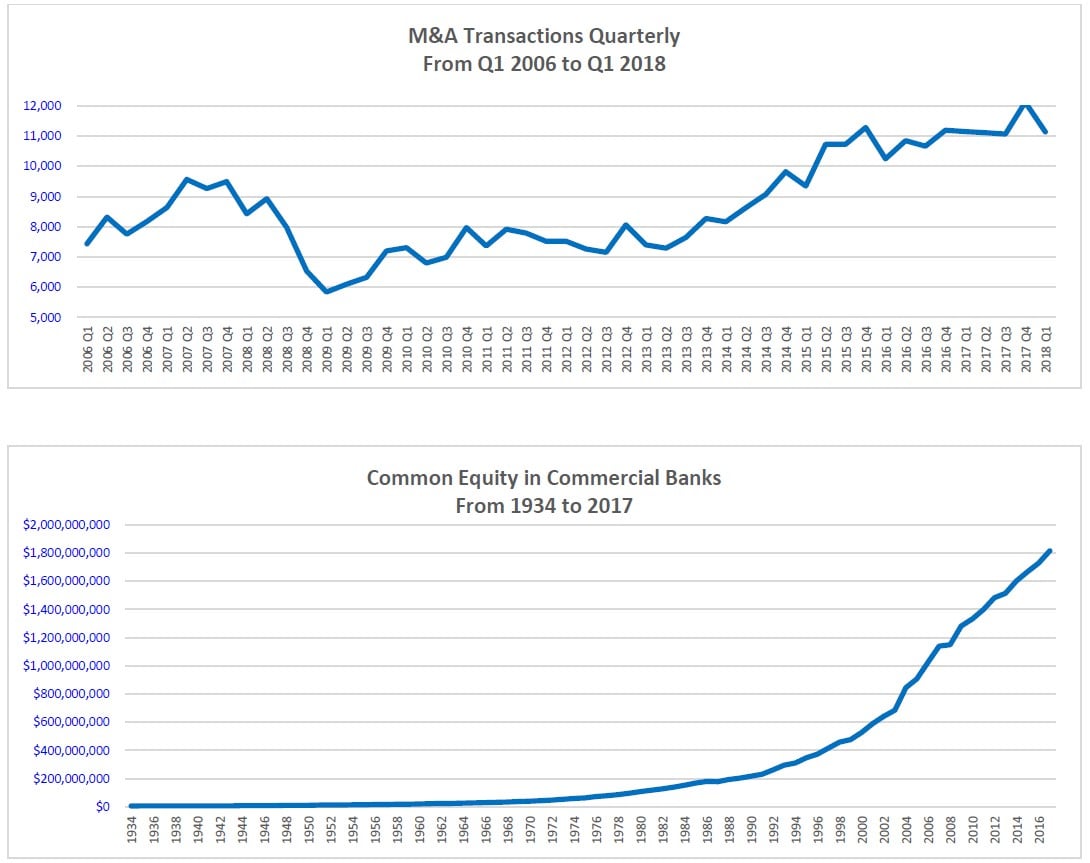
It is pointed out that as money availability tightens, there are three sectors that will demand a meaningful increase in funds. As described below they are:
- Federal debt;
- Housing; and
- Mergers and acquisitions.
Bank Positioning
The next three sections of this report suggests that banks will benefit in an environment when money is constrained, interest rates are rising, and the demand for funds is increasing.
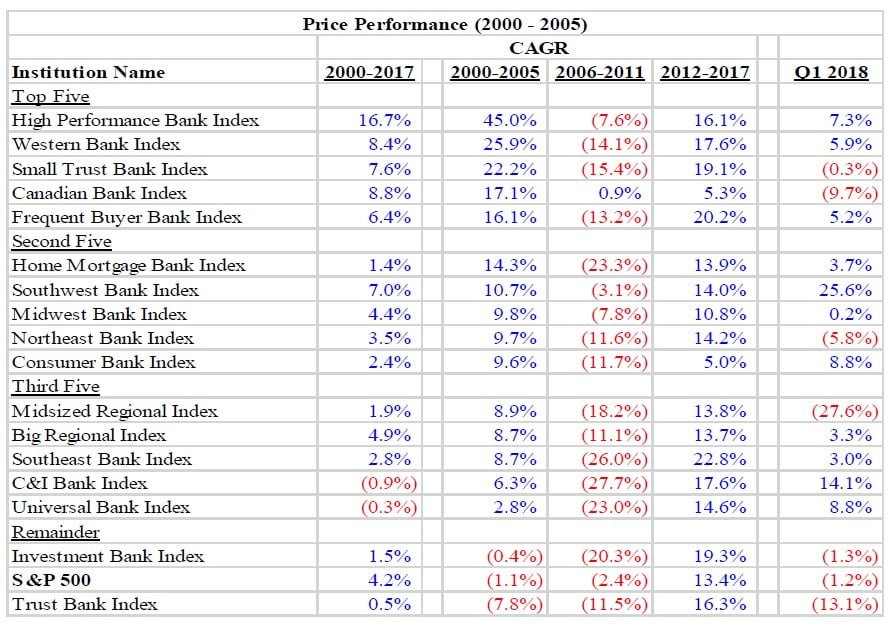
In Part Two, it is pointed out that banks will have an advantage because structurally they have preferred access to money. They offer safety of deposits, transaction services, and the most advanced technology available in the financial or, for that matter, any industry. In the environment envisioned, it is believed that banks also regain some control over pricing.
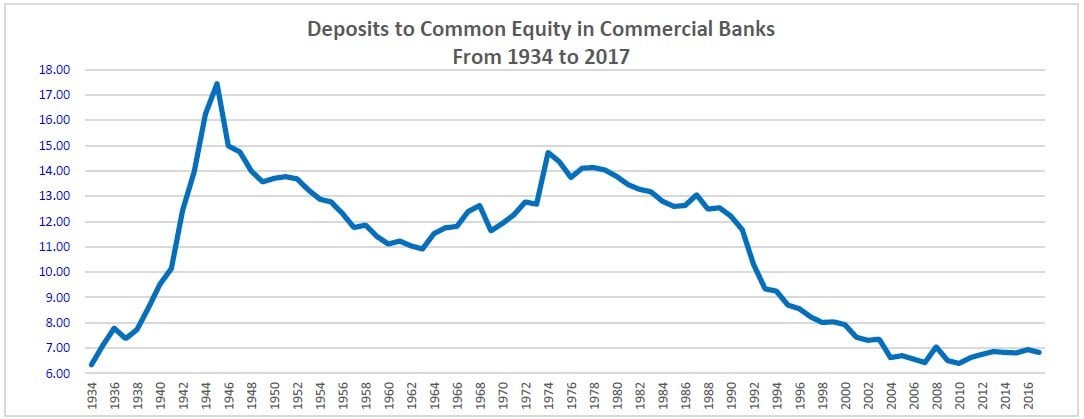
It is also noted that American banks now have record amounts of capital and are unusually liquid. Their balance sheets are similar to a factory running at 70% of capacity – i.e., they are under earning.
In Part Three, a primer is provided in how to invest in banks stocks. The industry is compared to the industrial sector. The point here is that a bank must sell a lot of some product – notably loans -- to be attractive. The false arguments concerning banks are also explored -- e.g., the importance of interest rates and stock buybacks.
In Part Four, a methodology is provided for picking bank stocks along with suggestions as to where investors are likely to find good value. Part Four can be read independently of the other sections of this report and it begins on page 78.
The full report begins on page 12.
KEY CHARTS & TABLES FROM REPORT
METHODOLOGY
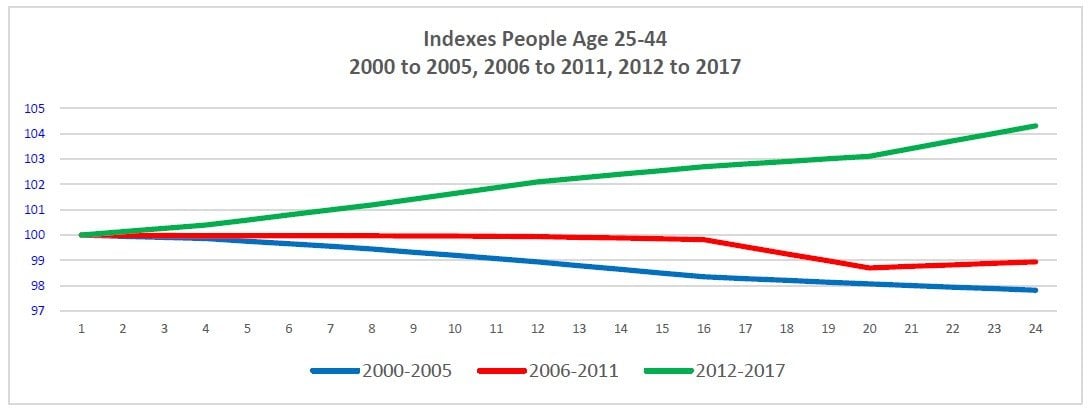
The analysis in this report is based on developments in three periods
- The “Good Times” – i.e., 2000 to 2005;
- The “Bad Times” – i.e., 2006 to 2011; and
- The “Recovery Period” – 2012 to 2017; and
To clarify certain issues, some of the data series provided begin in 1934 for banks and 1947 for the economy. There are also a number of subjective projections concerning the future of the financial system, banking, and bank stocks.
What is Money?
In this monograph theoretical discussions as to what money is are of no concern, money, simply stated, is composed of three elements:
- Currency printed by the Federal Reserve or, in some rare instances, by the U.S. Treasury;
- Deposits created in the banking system; and
- Synthetic funds created in the derivatives markets.
Data Sources
The data sources used to monitor money creation and money flows are published by the Federal Reserve as follows:
- Factors Effecting Reserve Balances (H4.1);
- Money Stock Measures (H.6);
- Assets and Liabilities of Commercial Banks in the United States (H.8);
- Selected Interest Rates (H.15), and
- Financial Accounts of the United States (Z.1)
The bank data is from both the Federal Reserve and the Federal Deposit Insurance Corporation. The economic data referred to in this report has been derived from the Bureau of Economic Analysis. Census data comes from the Census Bureau. Foreign money flows are provided by the United States Treasury Department. The estimates and ratios were calculated by Hilton Capital Management.
Caveat: there is no good source of data concerning money created in the derivative markets. Therefore, it is simply assumed that the growth of “synthetic” money mirrors the growth in transaction money albeit at a slower rate than in the past. The slowdown is believed to be due to new bank regulations concerning off-balance sheet activities.
Comparative Technique
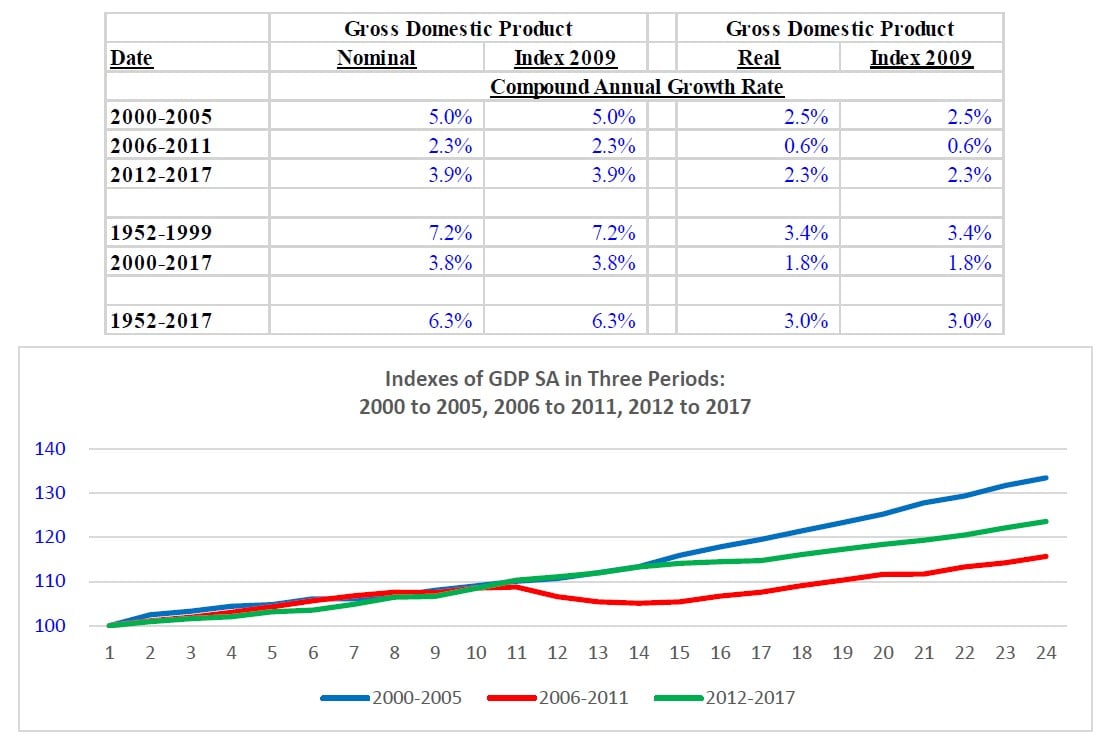
A number of charts were constructed using indexes. Three sets of quarterly indexes have been created for the Good Times, the Bad Times and the Recovery Period. In each case, the first quarter is designated at 100 so each period can be compared from a similar base.
FUNDAMENTAL BELIEFS
Sources and Uses of Funds
For most of this century, and earlier, the Federal Reserve has pursued a relatively aggressive policy of monetary ease. In the Bad Times (2006 to 2011), the Fed made sizable amounts of money available and it maintained record low interest rates for a very long period. These policies did not stimulate a significant amount of borrowing on a relative basis. Both debt security sales and bank lending declined at one point. Consequentially, a substantial amount of the available funds were not used in the debt markets and, therefore, flowed into the equity markets.
In late 2017, the monetary/interest rate landscape changed. The Federal Reserve meaningfully shifted its monetary policies. Possibly, for the first time ever
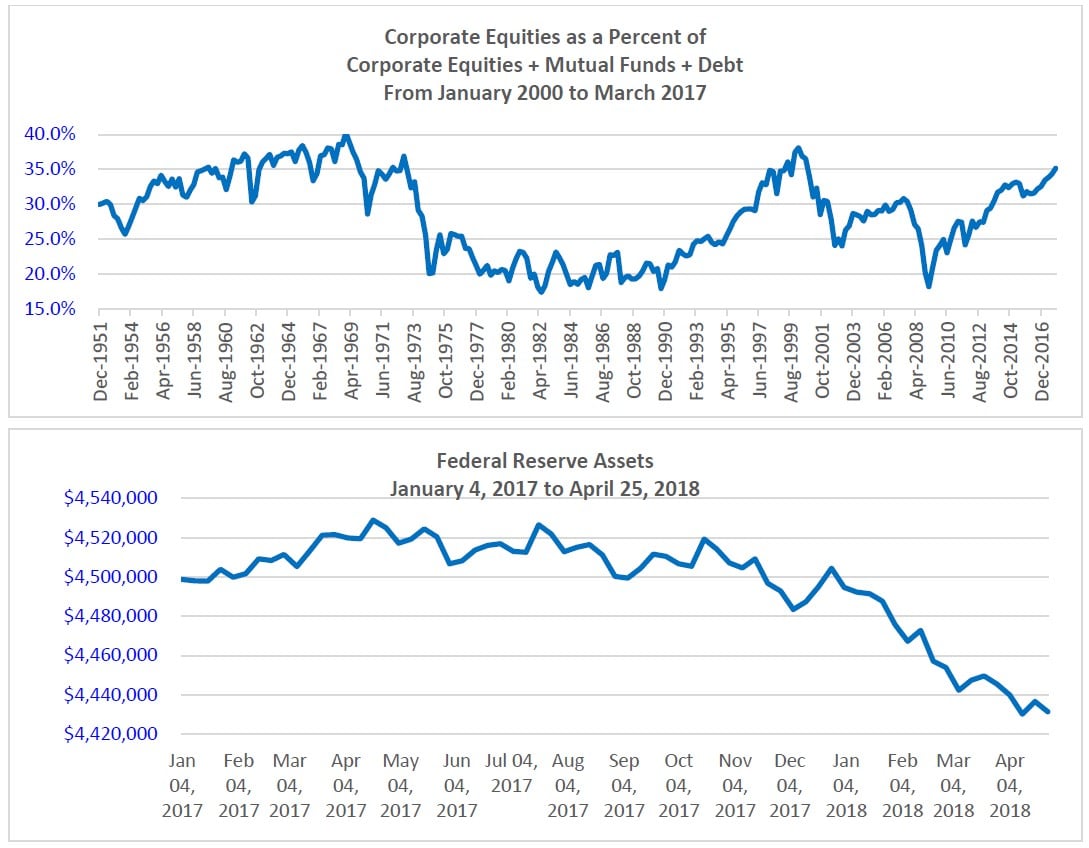
- The Fed balance sheet was to be reduced in size, and it has declined by $249 billion since Q4 2017; and
- Interest rates were to be increased and have been increased six times starting in Q4 2015.
At the same time, there was a shift in tax and trade policies. Promises were made that additional fiscal stimulus would be coming. Consequently, the debt markets began expanding once again and banks are lending more money.
Thus, the financial system has completely reversed itself. It has gone from:
- Excess supplies of funds at record low prices in a period of relatively low demand for funds; to
- More restrained fund flows at higher rates at a time when the demand for money is increasing.
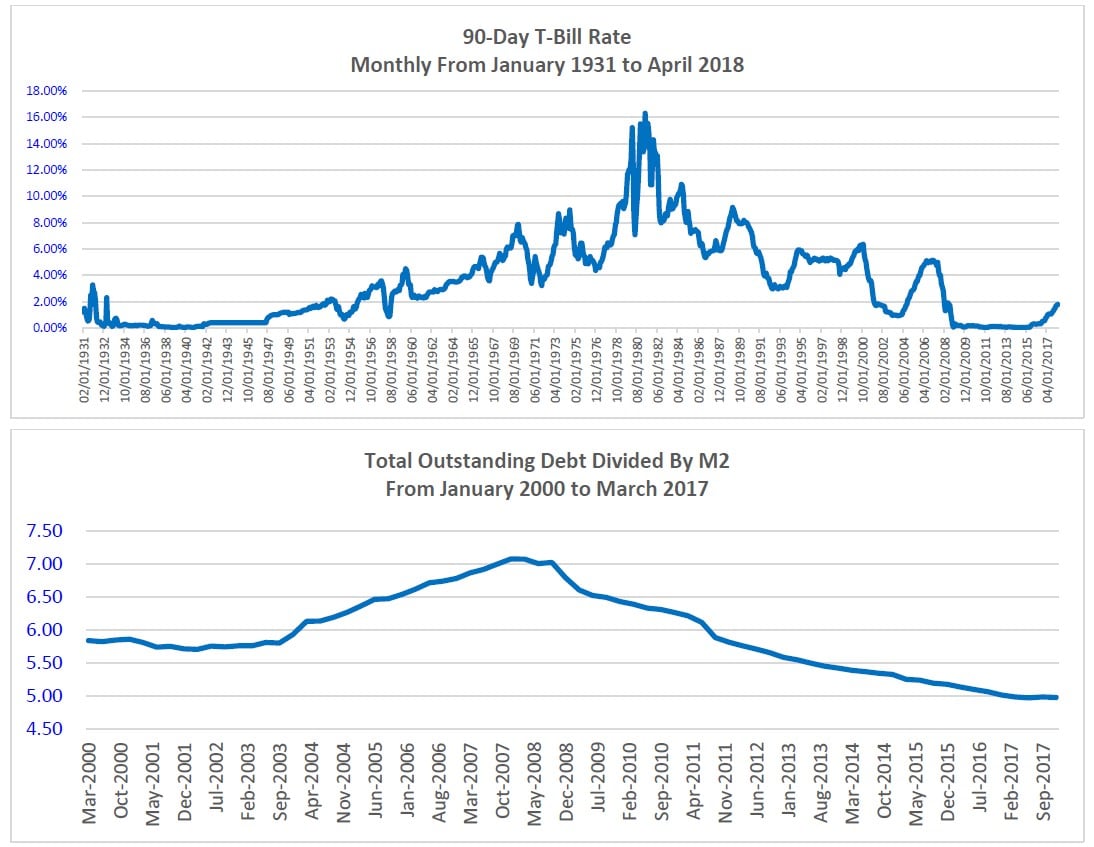
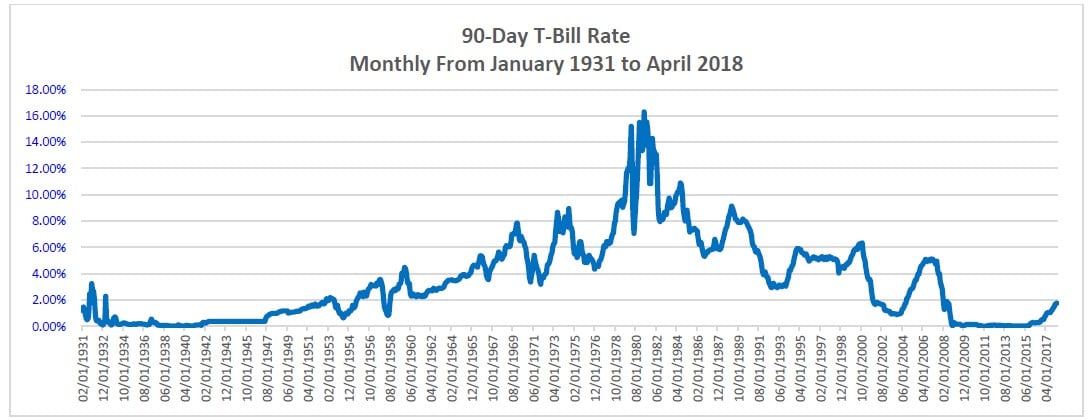
Changes of this nature are not for short periods. They last for decades. Note the movement in the 90-Day T-Bill from 1931 to the present. It basically went up and then it went down. Two directional moves in almost 80 years with, it would appear, a third directional move coming.
The proposition that will be made in this report is that the winners in the new environment are likely to be those entities with stable and growing fund flows, and high levels of liquidity.
Three Economic Periods
To clarify why this is likely to be the case the movement of the economy and of funds have been tracked through the three economic periods noted above (Good Times, Bad Times and the Recovery Period). First, however, note that the growth of the United States economy in the past two decades has been slower than the growth in the prior two decades as measured by nominal GDP.
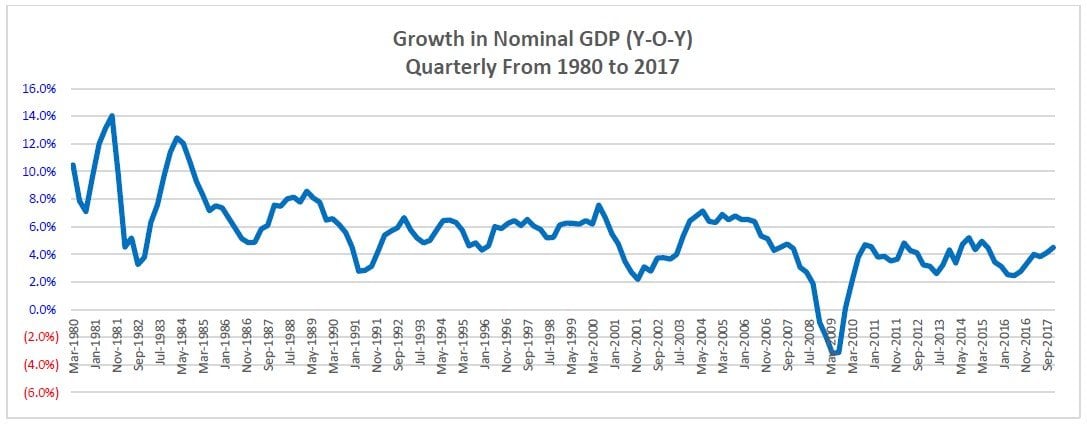
Further, note that the growth in the past 15 years has been highly erratic.
The volatility in these periods had significant impacts on money flows and interest rates.


