
When you think about it, the journey of each individual currency note is pretty incredible.
After being printed or minted, each bill is then passed between people and businesses to facilitate transactions. If it’s a $1 or $5 bill, it changes hands on average about 110 times per year – and if it’s a $20 bill, it’s more like 75. The interesting part is that almost every transaction is linked to the one before it, and the series of subsequent transactions for each bill creates a unique, broad story.

By the time a bill is retired, it would have facilitated many hundreds of transactions that enabled everything from the purchase of used cars to the shadier deals in underground markets. It’s a pretty interesting tale for such a little piece of paper.
Dollar Bills, in Aggregate
Today’s infographic from TitleMax gives a sense of what happens when all of those individual stories are combined together into one large one: the U.S. supply of currency notes, the shelf life of each type of bill, and how the whole system works as a whole.
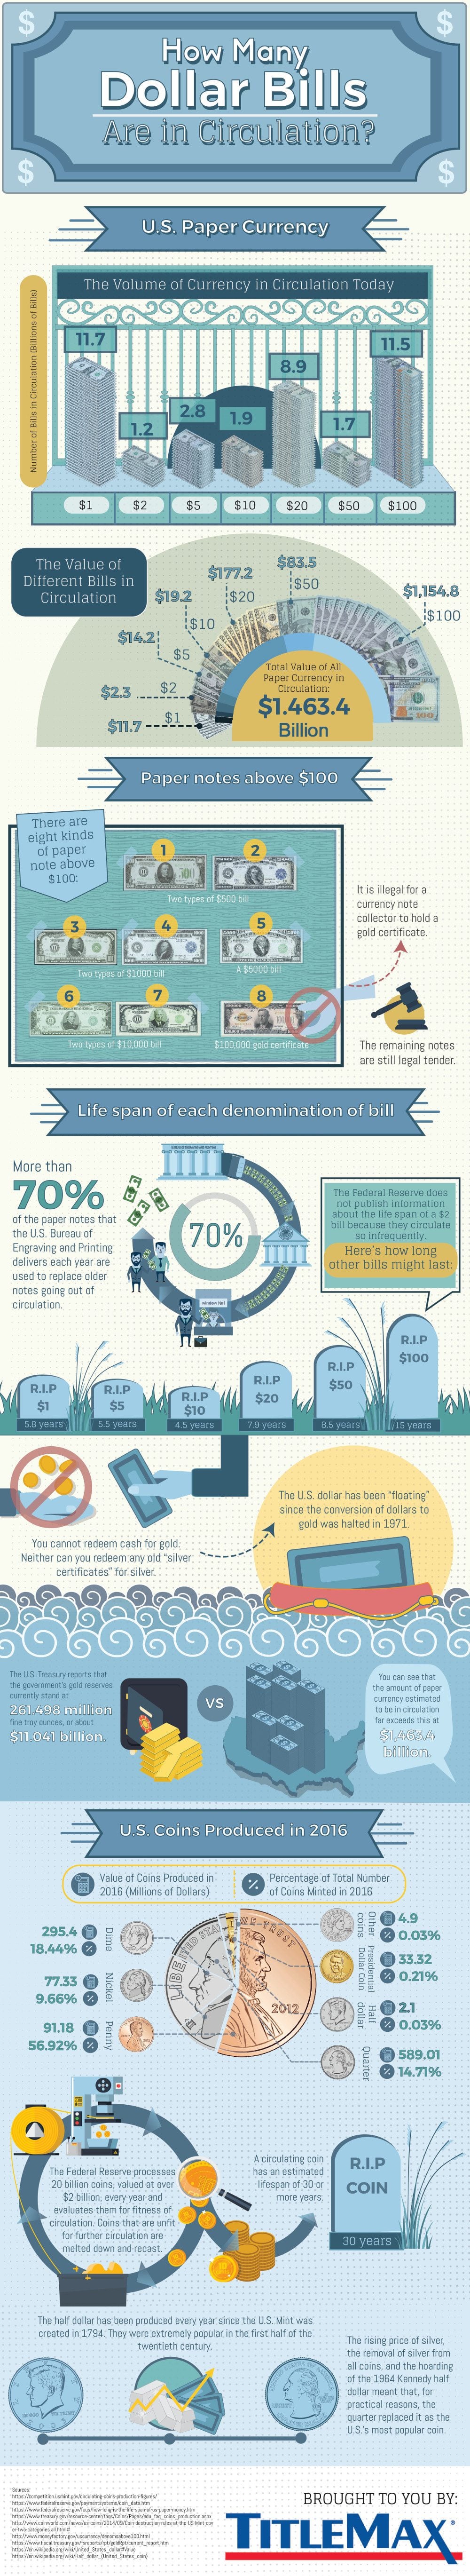
In total, there is a total of about $1.5 trillion in U.S. physical currency in circulation, and roughly 80% of this value comes from the 11.5 billion $100 notes that are in circulation.
| Note | Number of bills in circulation |
|---|---|
| $1 bill | 11.7 billion |
| $2 bill | 1.2 billion |
| $5 bill | 2.8 billion |
| $10 bill | 1.9 billion |
| $20 bill | 8.9 billion |
| $50 bill | 1.7 billion |
| $100 bill | 11.5 billion |
Of course, as we showed in All the World’s Money and Markets, this is just a fraction of the total money that exists as a whole, which includes digital deposits and liquidity added by central banks. That’s why, in the U.S. today, there’s about $14 trillion in total money supply (M2), of which physical currency makes up only about 11% of the total value.
Turnover Per Bill
Every year, the U.S. Bureau of Engraving and Printing is responsible for printing new dollars – and interestingly, 70% of these new bills are used to replace older notes going out of circulation.
That raises the question: how long does each bill last on average?
| Note | Average Life Span |
|---|---|
| $1 bill | 5.8 years |
| $5 bill | 5.5 years |
| $10 bill | 4.5 years |
| $20 bill | 7.9 years |
| $50 bill | 8.5 years |
| $100 bill | 15.0 years |
This means that printers are mostly turning out new batches of $1 and $20 bills, since there are more of those in circulation than most other bills.
At the same time, many new $100 notes are also being printed as well since they are the second most common bill. However, these last 2-3x as long as smaller denominations.
Article by Jeff Desjardins, Visual Capitalist


