Article by RCM Alternatives
We couldn’t help but be grabbed by this great line from Resolve Asset Management in their latest article to find Capital Efficiency. The “bar” the three Alts Funds walk into is actually your everyday 60/40 portfolio, and they smartly compare portfolio returns when adding the three different Alts – something you’ll see widely done across the internet. But while most people are trying to show you the benefit of adding Alts in terms of increased performance and decreased risk, Resolve has a bit more nuanced approach, looking at things not just from the point of view of the added benefits, but also on how it’s important to understand those benefits from what they call a capital efficiency (or bang for your buck) standpoint, and what we’ll call a unit pricing view.
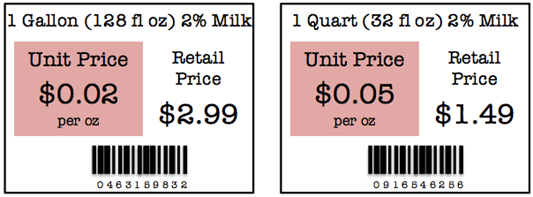
[REITs]In what must have been snuck into some law somewhere along the line, you’ll see labels like this on supermarket shelves across the US (and EU and Australia).
The concept here is easy to understand – that a cheaper price tag doesn’t mean you’re getting the cheaper price. Turns out, when buying milk or just about anything else – you can pay less (per unit) by paying more for a larger quantity. Jumping back into the investment world, Resolve is basically saying the quantity, or ounces, in the investment product world is the volatility of the investment. We’re often taught volatility is bad, but when considering costs – you want more volatility per unit of cost, all else being equal. The question Resolve asks, is what’s the better price per unit value up there on the investing supermarket shelf, where there are no Unit Prices:
- A market-neutral equity fund with an expected gross Sharpe ratio of 1.1, targeting 7% annualized volatility on up to 300% gross exposure, with a gross expense ratio of 2.24%, and 0 correlation with the current portfolio
- A managed futures mutual fund with an expected gross Sharpe ratio of 1.1, targeting 12% annualized volatility on up to 300% gross exposure, with a gross expense ratio of 2%, and 0 correlation with the current portfolio
- A GTAA ETF of ETFs with an expected gross Sharpe ratio of 0.8, expected long-term average annualized volatility of 8.25% on a maximum of 100% gross exposure, with a gross expense ratio of 0.8%, and a correlation of 0.5 with the current portfolio.
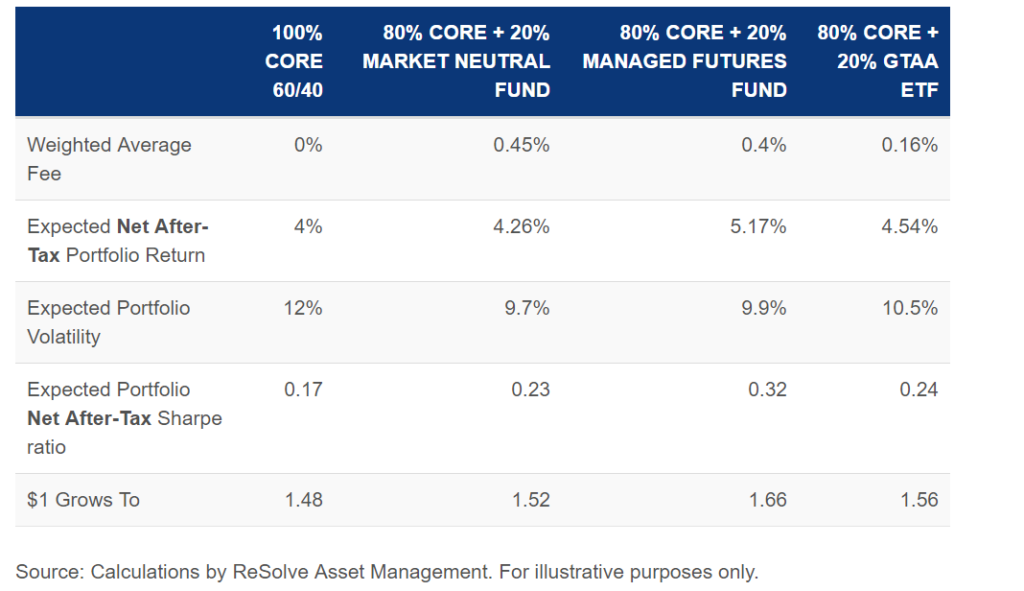
Of course, these aren’t the same jugs of Milk, so to speak. They have different correlations, market approaches, and of course – volatilities – making the math not quite as easy as at the supermarket. But it’s still just math, and Resolve crunches the numbers to show the effective weighted average fee when adding each Alts program, and resulting performance. The numbers show that the Bogle-head view of paying low fees above all else is not necessarily the best plan for ending up with the best return, or better yet – risk adjusted return.
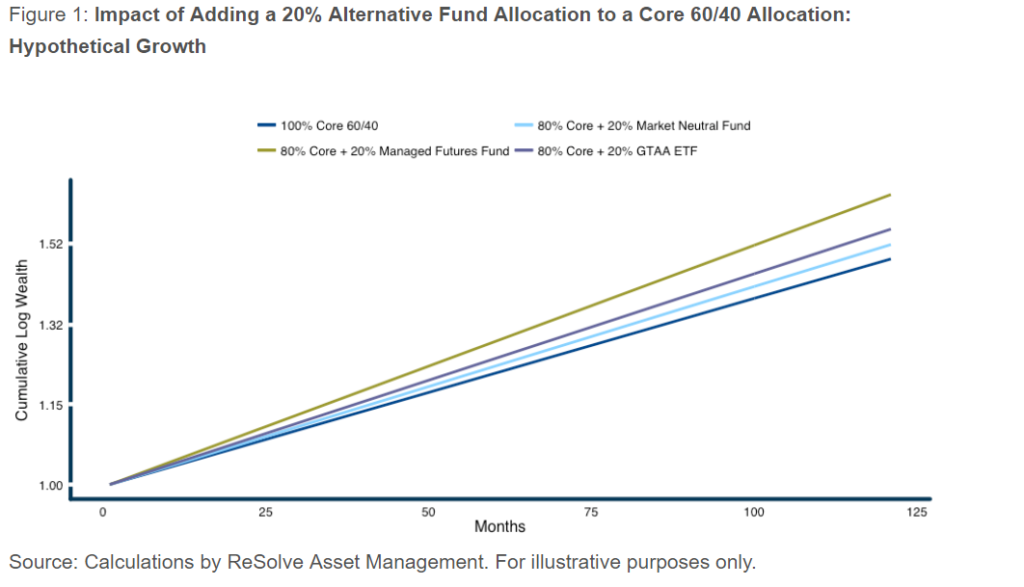
Table 1: Hypothetical Impact of Adding a 20% Alternative Fund Allocation to a Core 60/40 Allocation: Summary Statistics
Head on over to their website to view the full piece and check out their Adaptive Asset Allocation mutual fund here: (RDMIX) Rational/ReSolve Adaptive Asset.
PS – here’s one of our favorite ‘walk into a bar’ jokes:
A Bear walks into a bar… the bartender asks him what he’ll have… he thinks a bit, mutters some umms, and ahhs, and finally, after a longer than usual time, orders some honey juice. The bartender says, coming right up… but why the big pause?
To which the Bear lifts up his arms, shakes his hands, and says…. I don’t know, I’ve had them my whole life.


