Introduction
This is the third of a five-part series presenting 50 dividend growth stocks that I have screened for current fair value. With this article I will be covering 10 additional dividend growth research candidates with moderate to higher yields in addition to the initial 20 that I presented in part 1 found here and part 2 found here. This will be the last part of this series where I am primarily presenting dividend growth stocks with current dividend yields of 3% or better.
As I have been moving down the dividend yield curve, the reader might notice that both historical and estimated earnings growth and/or cash flow growth will be higher on many of these companies. Therefore, there will be several candidates in this group that I believe can generate above-average total long-term returns in addition to consistent dividend growth. Nevertheless, the future total return will be a function of the relative current valuation in conjunction with each company’s earnings and dividend growth potential.
The Ying and Yang of Valuation
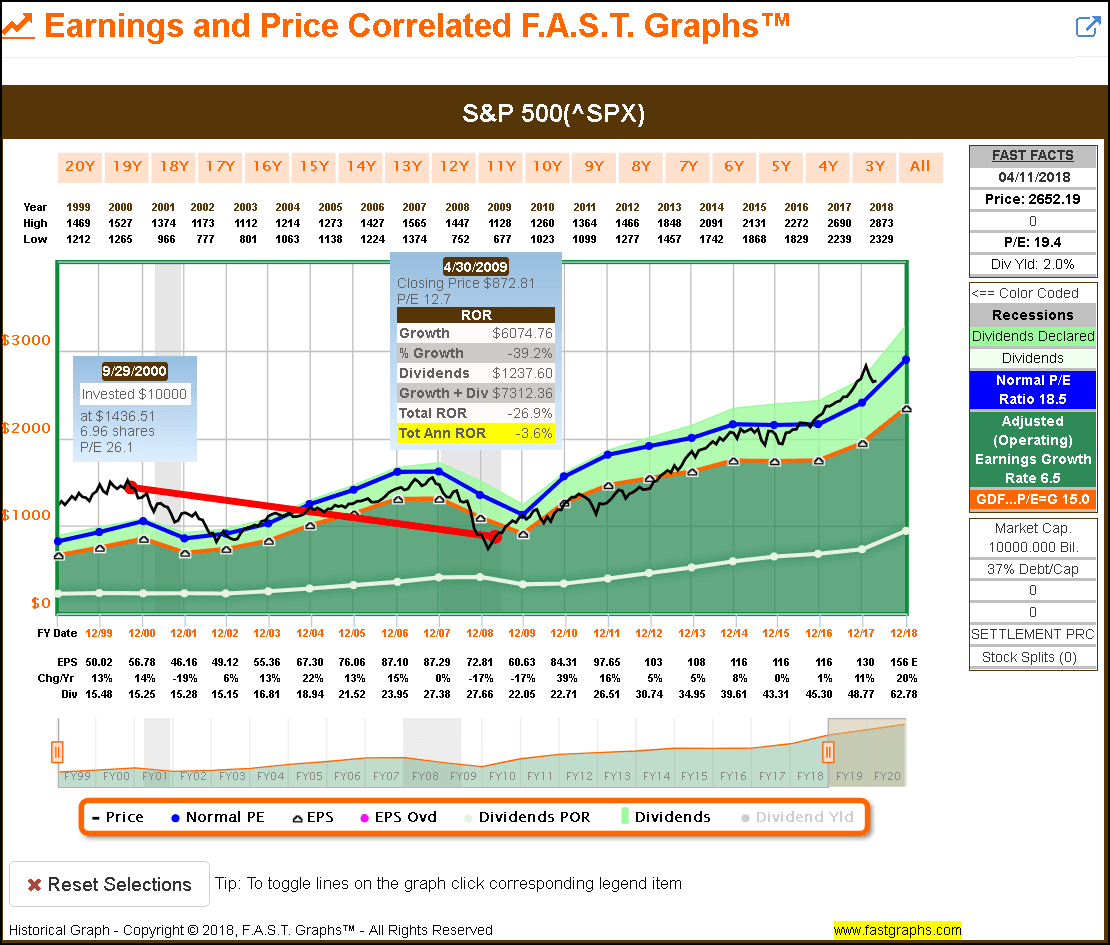
Since this part 3 represents the middle of this five-part series I felt it would be only appropriate to provide insights into the opposite of fair or attractive valuation. On many occasions throughout this series I alluded to finding value in an otherwise generally overvalued market. Therefore, I offer the following earnings and price correlated FAST Graphs on the S&P 500.
For those not familiar with FAST Graphs there are three important lines on the graph that I would like to focus the reader’s attention on. The first two lines (orange and dark blue) represent important valuation references.
The orange line is generated based on a widely accepted formula for valuing a business – or in this case the S&P 500. What’s important to note is that the orange line on this graph is calculated as a P/E ratio of 15. To be clear, each year’s earnings reported at the bottom of the graph are plotted as a multiple of 15. Therefore, the orange line is a P/E ratio of 15 across the entire graph. This reference line is offered as a theoretical fair or optimum value calculation.
The dark blue line is essentially a normal P/E ratio calculated as a trimmed average over this timeframe. Trimmed average simply means that one high and one low valuation is removed to normalize this valuation reference. However, please note that the normal P/E is exaggeratedly high due to the initial high valuations. The dark blue color-coded rectangle in the “FAST FACTS” boxes to the right of the graph indicate that the dark blue line (the normal P/E ratio that the market has applied over this timeframe) is drawn as a historically normal multiple of 18.5.
The third line I draw the reader’s attention to is the black line, which is simply a plotting of the S&P 500’s monthly closing stock prices over this timeframe. Consequently, whenever the price is above the dark blue line is a time when the S&P 500’s P/E ratio is above 18.5, and when the price is above the orange line is a time when the S&P 500’s P/E ratio is above 15. Simply stated, this represents a rational and/or normal valuation range for the S&P 500 since 1999.
With these perspectives in mind, important insights into the S&P 500’s historical and current valuation are revealed. For starters, we see the effects of extreme valuations for the S&P 500 during the “irrational exuberance” timeframe 1999 through 2000. Utilizing the built-in FAST Graphs return calculator I have included a performance calculation on the S&P 500 from its peak valuation in September 2000 to its trough valuation on April 30, 2009.
It should be obvious and clear to the reader that this was not an optimum time to be invested in the S&P 500 index. More importantly, it should also be obvious and clear that the primary culprit that led to such poor long-term returns for the S&P 500 can be primarily attributed to overvaluation. Of course, negative earnings growth over the timeframe 2007 through 2009 also contributed to what has been referred to as the “lost decade.”
With this next screenshot of the S&P 500 I provide a calculation of performance from its trough valuation on March 31, 2009 to its current high valuation on its April 11, 2018 closing value. I suggest that this provides a clear and factual illustration of the extreme importance of valuation as it relates to long-term performance.
Furthermore, there are additional insights that this second example also provides. Close examination reveals that the market rationally tracked the orange fair valuation reference line through September 2013 from which it has become more and more overvalued to current time.
Importantly, we also can see that valuation has gone outside of its historically normal range (the 15 P/E ratio orange line and the 18.5 normal P/E ratio dark blue line). This clearly illustrates why I have been suggesting that we are now in an overheated (overvalued) stock market. Additionally, the reader is also given a perspective of just how “long in the tooth” this bull market has gotten. Moreover, I would further suggest that based on its current valuation, now is not a good time to be investing in the S&P 500 index.
As an interesting aside, readers may also find it valuable to review the article I published on April 7, 2011 titled “Q1 2011: The S&P is Fairly Valued” found here.
This article was published during a time when investor sentiment was quite negative. Moreover, the comment thread in this article might be more valuable to read than the article itself.

Most “Dividend Aristocrats” are Currently Overvalued
Next I offer an earnings and price correlated FAST Graph on the Dividend Aristocrat and Champion General Dynamics Corporation (GD) as a clear example of overvaluation. I chose this specific example because it offers several significant aspects and lessons on the importance of valuation. From 1999 through July 2008 General Dynamics’ stock price was clearly tracking earnings. In other words, where earnings went, price followed.
However, the Great Recession that followed brought on an extended period of extreme undervaluation. I believe this speaks loudly to the point I made in part 1 as follows: “Unfortunately, although I believe it is inevitable that stocks will move into alignment with true worth valuation, the exact timing of that occurrence is unpredictable.” With this example, it took the better part of five years before General Dynamics’ stock price inevitably moved back into alignment with fair value (back to the orange line).
In contrast, starting in October 2016 to current time, General Dynamics has clearly become significantly overvalued relative to both historical norms and rational intrinsic value calculations. Consequently, I now contend that General Dynamics has become dangerously overvalued. But once again, there is no way to predict precisely when price might move back into alignment with fair value. On the other hand, I do believe it is an inevitability.
FAST Graphs Portfolio Review: Next 10 (21 through 30 of 50) by Yield
The following portfolio review provides a summary of important metrics for the next 10 highest yielding fairly-valued research candidates. The reader should note that the last 2 columns (light brown) provide annualized total return estimates based on the consensus 3 to 5 years trend line analyst estimates of either cash flows or earnings. The first light brown column provides total annual return estimates based on earnings, and the second light brown column provides total annual return estimates based on cash flows.
It’s also important that the reader understands that the primary attributes that each of these 10 research candidates have in common is fair valuation coupled with a higher yield than the average company. Moreover, each individual candidate will not necessarily be an appropriate investment for every dividend growth investor. I believe is vitally important that each investor builds portfolios according to their own unique goals, objectives and risk tolerances. For example, some of these candidates might be appropriate to boost the yield of an existing portfolio while others might be more appropriate for investors seeking a higher total long-term return. Therefore, I suggest that readers might pick and/or choose to examine only those that meet their own personal needs. I will be elaborating more on this important aspect in the FAST Graphs analyze out loud video to follow.
FAST Graphs Portfolio Review:
Principal Financial (PFG), Omnicom Group (OMC), CVS Health (CVS), National Fuel Gas (NFG), Penske Automotive (PAG), Whirlpool Corporation (WHR), Cardinal Health (CAH), Hasbro (HAS), Ryder System (R), Walgreens (WBA)
FAST Graphs Analyze out Loud Video
In the following video I will briefly illustrate why I believe each of these 10 research candidates are currently fairly-valued. Additionally, I will provide commentary on what type of portfolio or dividend growth investor they may be appropriate for. Furthermore, a word of caution relative to recent market volatility is also in order. With the stock market fluctuating as much as it recently has been, valuations and current dividend yields are presently very dynamic.
Summary and Conclusions
Most of the fairly-valued dividend growth stock research candidates presented thus far have offered moderate to high current yields. As a result, many of these candidates provide low or perhaps only moderate future capital return potential. Consequently, most of these companies would be most appropriate to those dividend growth investors desirous of current income.
However, as I move down the yield curve into Part 4 and finally Part 5, we will begin to discover dividend growth stocks with higher historical and forecast earnings growth rates. Consequently, I believe that readers will find greater total return opportunities among the candidates presented in these forthcoming articles.
Finally, please remember that as a rule (and there are always exceptions to every rule), investors generally face a trade-off between growth and income. This same principle applies to risk. In theory, investors must be willing to take on greater risk to achieve higher rates of return. These principles speak directly to why investors need to invest according to their own goals, objectives, and risk tolerances.
Disclosure: Long CVS and PAG
Article by F.A.S.T. Graphs


