DEJA VU (part 2): A familiar situation.
Peak Oil was on my mind during the first decade of this 21st century, then I lost interest in it as shale field supply became readily available, especially in the United States. The idea around peak oil is that new discoveries are rare while the older and larger fields are being depleted from constant withdrawal of finite supply. Now it is all back in my thoughts.
[REITs]Papa says: “Peak Oil.”
Yes, Mark Papa, one of the most important and respected pioneers and innovators in the critical U.S. shale oil revolution, recently went on record as saying that drillers have permanently burned through the bulk of their best shale field assets and that forecasts for future U.S. production growth are “overly optimistic.” He further feels that actual oil resource exhaustion (past peak) is beginning to take place. There are only three shale fields in the United States of any consequence, so drillers will now have to go after lower quality acreage and at a much greater expense. Stock shareholders do not want this because it will eat through corporate capital. They may punish these shale companies by selling off their stock and lowering the equity valuation of these companies.
MarketCycle feels that we are in the second half of the late-stage of the current market cycle. This is the period when inflation naturally increases; inflation causes the price of commodities to rise even without any additional scarcity. Near term, oil prices likely head higher. This will cause the production of lower quality fields to ramp up despite shareholder’s concerns, and it may also mean that during the next economic recession, the stocks of oil and shale producers may get hit hard.
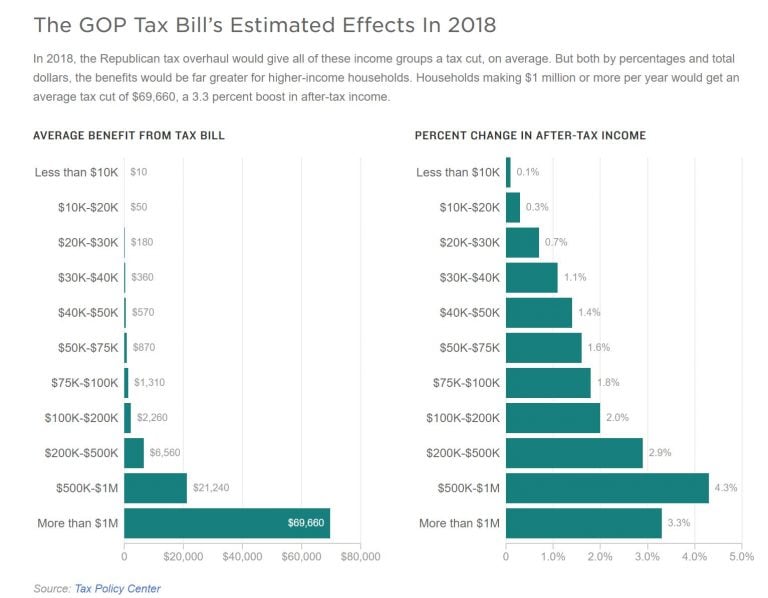
U.S. tax-law benefit in 2018 based on income bracket (it pays to be rich):
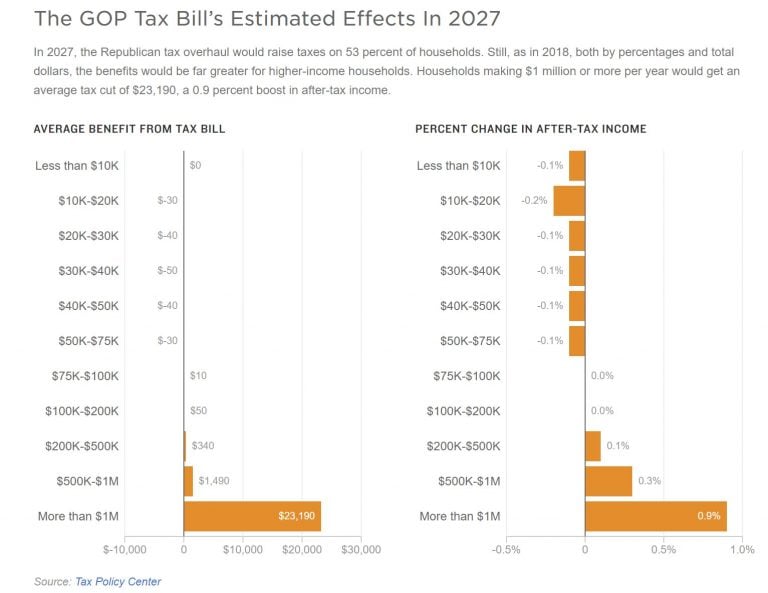
And the U.S. tax-law benefit in 2027 based on income bracket (it still pays to be rich):
Market UPDATE: Fears of an outright market crash similar to 1987 are slowly passing as the stock market finally starts releasing its pent up steam. The recent drop was powerful but all stock indices have held above their 200 day simple-moving-average (SMA) support lines. If the S&P-500 were to fall below its 200 SMA then it will naturally want to re-test its February lows at 2530. There is a >50% chance that this happens. If the market were to then fall below the February bottom, then it might drop all of the way down to 2340 on the S&P-500, where the following 3 important ‘technical analysis’ factors converge to form massive and strong support (which would be almost impossible to break below):
- 50% retracement off of the January highs (for the late-stage bull leg that started in early 2016)
- very long-term trend-line support (for the entire bull market that started in early 2009)
- ‘measured move’ of the giant 2018 sideways consolidation triangle in the S&P-500
IMO, much of technical analysis only works because millions of traders BELIEVE that it works and they work in unison to create these self-fulfilling prophecies. (If you do not know what technical analysis is, please Google it.)
If the S&P-500 were to bottom @ 2340, this would keep us (just) out of technical bear market territory and I would then expect an explosive move upward and for new highs to be reached well before the end of this year; this is because we are still in a bull market! Regardless of what happens in the near-term, we eventually move higher.
MarketCycle Wealth Management’s client accounts continue to hold certain protective assets that can move up as stocks move down AND also move up as stocks move up… a good position to be in. We have little incentive to sell them since they do fairly well during the second half of the late-stage of the market cycle, like right now, and they become exceedingly strong as we move into economic-recession, which I can see on the far horizon. Gold can profit as inflation naturally rises during the late-stage. Extended-duration Treasury-bonds can profit as the yield-curve flattens, which always occurs well before recession. Dynamically hedged volatility options can profit as volatility increases to a higher trading range during the advancing late-stage, as is always the case. And our ESG ‘socially responsible’ corporate bonds can profit as investors dump their high-risk, high-yield corporate junk bonds (and senior bank loans) and buy quality, investment grade corporate bonds (I expect high-yield junk bonds & senior bank loans to be the weak links in the next economic-recession, as they get hit unusually hard). So we hold on, possibly taking lower profits but also taking on a lot less risk; we’ll make up any lost ground during the next recession. Overall, we continue to beat our benchmarks and I expect this out-performance to continue.
It is a good time to invest money since we currently have lower stock prices. Remember to buy when your fear is greatest per the old Wall Street saying: “Buy when there is blood in the streets.”
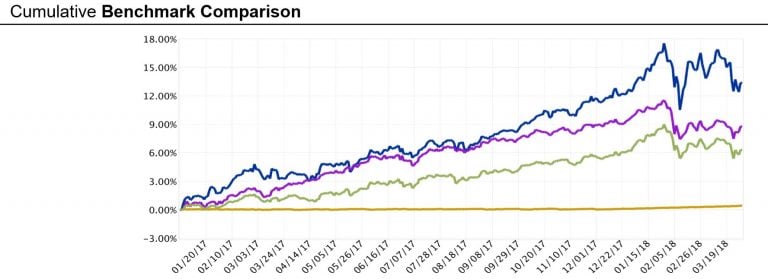
PORTFOLIO PERFORMANCE January 1, 2017 to March 31, 2018 (2017 is when tracking accounts were funded). Shown with no management fees extracted, however, only the MarketCycle portfolio shows performance after trading and account fees were extracted, giving us a higher hurdle.
The performance order & the color used in the 4 bullets mimic the order & color in the chart:
- MarketCycle
- Buy & Hold Index (roughly 75% stocks and 25% bonds)
- Hedge Fund Performance Index
- Savings Account
Thanks for reading!
Article by Stephen Aust, MarketCycle Wealth Management


