Over the last year, the Sentieo team has been investing heavily in NLP & data science. We were very excited to release the Sentieo’s Transcript Intelligence Report, which is the first of many features built on a powerful new technology that lets us dissect documents and help you find insight.

Q1 hedge fund letters, conference, scoops etc
There is significant amount of academic research that supports the idea that changes in sentiment among those in company management, as well as those working as analysts, do indeed have some relationship with stock returns.
Management is typically a negative predictor of stock returns. When management seems overly excited about the future, this may indicate that the stock will underperform. (See “Manager Sentiment and Stock Returns,” Journal of Financial Economics). On the other hand, when investor sentiment is low, subsequent returns are relatively high on a subset of stocks (high volatility stocks, unprofitable stocks, non-dividend-paying stocks, extreme-growth stocks, and distressed stocks), consistent with an initial underpricing of these stocks. (See “Investor Sentiment in the Stock Market,” Journal of Economic Perspectives).
Our Transcript Intelligence Report provides automatic analysis on how sentiment and keywords for a given company have changed across quarters. The analysis easily splits out Management Sentiment vs. Analyst Sentiment. Let’s use Netflix as our example.
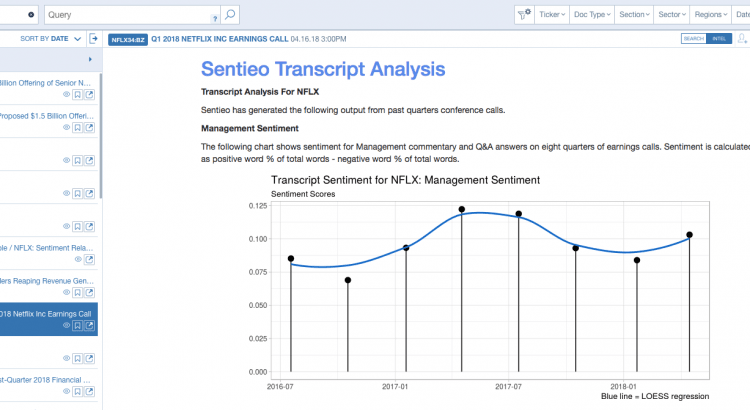
First, we open up Sentieo Document Search and search for Netflix transcripts. We choose a transcript in the left hand navigation, and see a “View Linguistic Intelligence Report” button at the top of the document in the right hand pane.

We’re taken to the full Transcript Analysis page, and can now dive into the analysis!
Sentiment Scores
Sentiment scores are generated by tagging each word in the document as positive, negative, or neutral using a dictionary designed for financial documents and applying a formula to generate a score for each section. The formula for sentiment is below:
The number (typically a decimal value below 0.1) is a percentage that should be considered on a relative basis, rather than absolute.
Management Sentiment
The following chart shows sentiment for Management commentary and Q&A answers on eight quarters of earnings calls. Sentiment is calculated as positive word % of total words – negative word % of total words.
Analyst Sentiment
The following chart shows sentiment for Analysts from the Q&A section of eight quarters of earnings calls. Sentiment is calculated as positive word % of total words – negative word % of total words.
Management-Analyst Sentiment Spread
The following chart shows the historical spread between Management and Analyst sentiment.
The spread between the two would suggest divergences in sentiment. For example, if the spread turned negative, then it is possible that management has turned less bullish while analysts have remained bullish, thereby signaling the potential for management to disappoint in future periods.
Conference Calls Sequential Comparison Word Cloud
The comparison word cloud shows the biggest changes in average keyword frequency between the 2018-04-16 conference call and the 2018-01-22 conference call for NFLX.*
Analyst vs Management: Keyword Differences
This is another comparison cloud showing the major average differences between management and analyst keywords on the 2018-04-16 conference call.
Management Top 15 Keywords
This table shows the top 15 keywords by frequency referenced in the past eight quarters of earnings calls. This provides a visual view at a glance into what is being discussed on the earnings calls over time.
Analysts Top 15 Keywords
Sign up for a free trial of Sentieo to get the sentiment report for Netflix and any other ticker you follow.
Article by Sentieo