Original article by UpFina
The March BLS monthly jobs report was a disappointment in terms of total job creation as only 103,000 were added instead of the 175,000 expected. Furthermore, the report missed the lowest expectation which was for 112,000. It’s important to recognize this is a volatile data point. The February job growth was revised higher from 313,000 to 326,000. February was a huge month and March was weak. When you average the two together, you get 215,000 which is a solid number and higher than the labor force growth, implying the labor market still has more slack (quantity of unemployed labor).

Labor Market Not Full
A full labor market, which is one without slack, signals the economic cycle is likely near its end.
The chart below is the year over year total nonfarm payroll growth.
Year Over Year Job Growth
The yellow highlights show when the labor market had a mid-cycle slowing period which the labor market recovers from. The red arrows signal the final growth peaks which eventually lead to a sharp downdraft right before the recession. There’s an arrow near the current period because growth peaked in February 2015. Unlike previous cycles, the growth peak hasn’t led to a recession soon afterwards. This might be because the labor market started the cycle with a high amount of slack because the 2008 financial crisis caused severe weakness in the job market. The July 2009 year over year decline was the worst since October 1949.
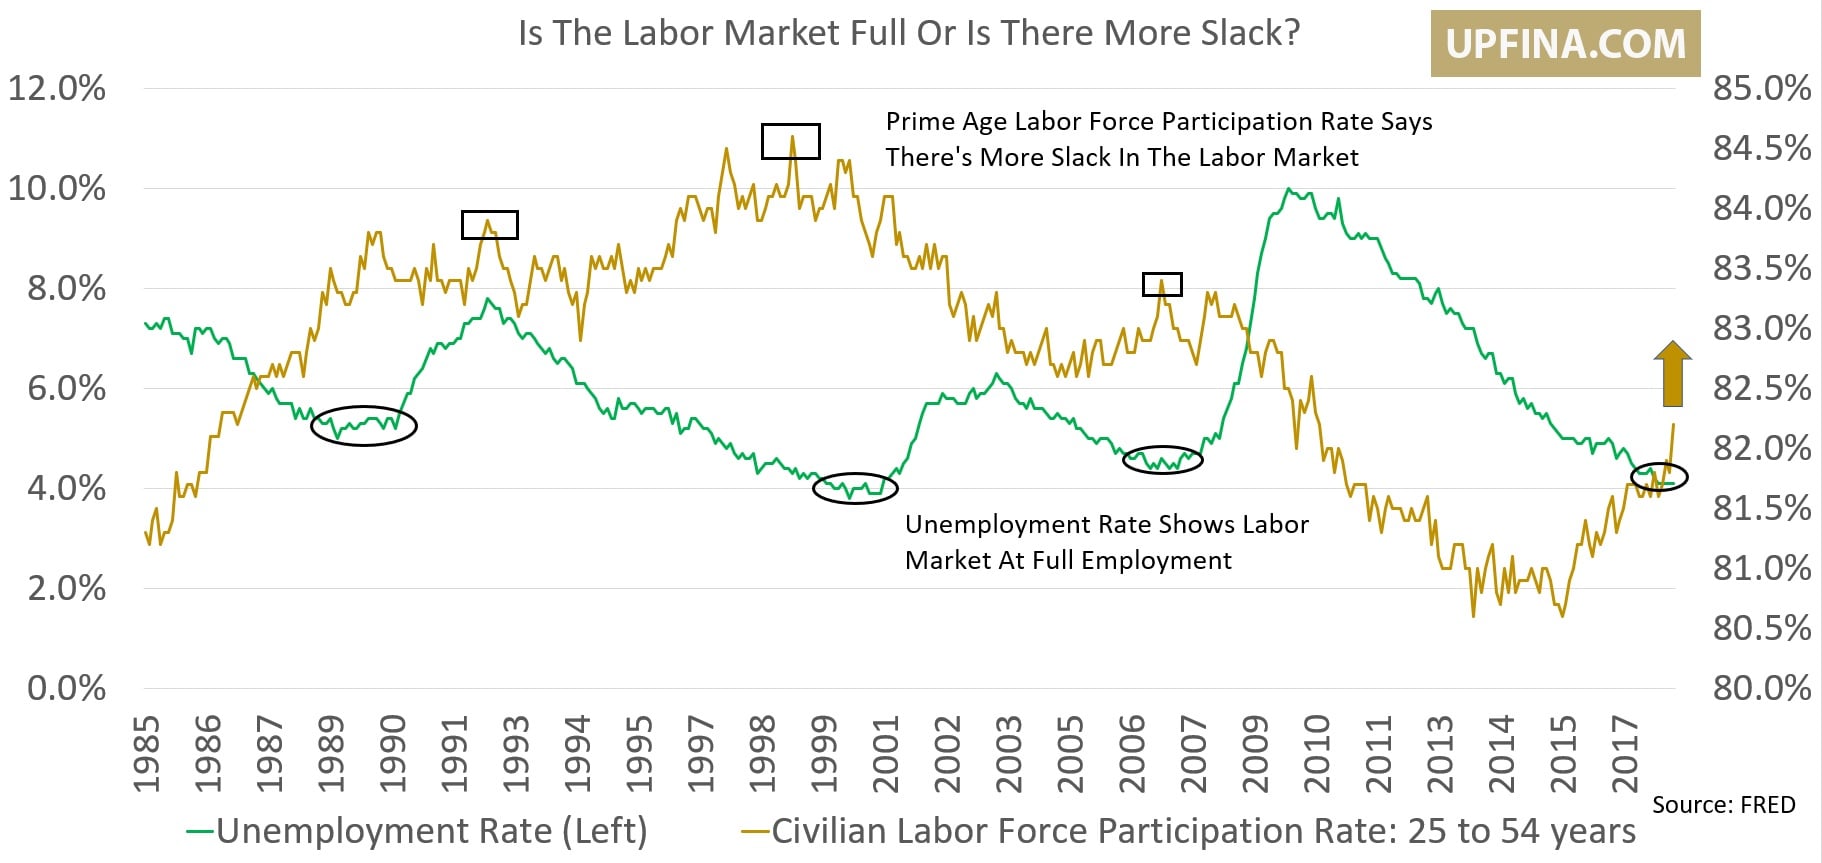
Don’t Focus On The Unemployment Rate
The charts below show a few of the most prevalent labor market indicators.
Overview Of The March Labor Report
Some claim the unemployment rate stabilizing instead of falling since October means the labor market is weakening, but that’s simplistic analysis. There’s a lot more to the labor market than this statistic. Those only looking at the U3 headline unemployment rate have been wrongly predicting that the labor market was full for a few years.
Looking at the recent data, the labor participation rate has increased in the past 4 months. It fell from 63% to 62.9% in March, but the uptrend in the months prior to that imply more people are getting jobs even if the unemployment rate has been flat. The employment to population rate for those ages 25-54 has been steadily increasing since 2015. The rate declined from 79.3% to 79.2% in March, but from October it is up from 78.9%. The employment to population ratio for all workers shows similar results in the chart above.
General Improvement In Most Stats
The U6 rate, seen in the chart above, is a measurement of all unemployed people plus those who are marginally attached to the labor force and those who are working part time for economic reasons. It’s known as the underemployment rate. It gives much more information than the U3 rate. As you can see, the rate fell from 8.2% to 8% in March. This is the cycle low. The previous cycle bottomed at 7.9%; the trough in 2000 was 6.8%. This signals the labor market is in its maturation stage. The percentage of workers working part time for economic reasons has fallen recently, contributing to the decline in the underemployment rate.
The chart below gives a better view of the long term unemployment rate because it gives historical data.
Long Term Unemployment Rate
The percentage of workers without a job who have been unemployed for 27 weeks and over is 20.3%. As with most data, the percentage bottomed at a higher level before the previous recession as compared to the one in 2001. The trough in 2006 was 15.9% and the trough in 2000 was 10%. There seems to be more room to the downside in this indicator which means there’s more slack in the labor market. The giant spike in the long term unemployment rate that occurred in 2009 is still being worked through. One point worth noting as far as the difference between the prior two cycles is that the housing bust and the financial crisis cut that cycle short, so it might be more likely that this cycle comes closer to matching the 1990s cycle than the 2000s cycle. This mostly depends on the potential catalysts for the next recession. The tech bust wasn’t nearly as big of an issue as the mortgage crisis.
Make Sure To Measure Wage Growth Correctly: It’s Improving
The hourly wage growth was 2.7% year over year and 0.3% month over month. This stat isn’t the best when studying the labor market because the length of the work week manipulates it. In this month, the work week was stagnant at 34.5 hours, but in other months the hourly pay was affected by the length. The better indication is the weekly earnings growth, since take home pay is what matters to consumer spending, which drives the economy. The weekly earnings growth was 3.32% which was the 3rd strongest month of growth since this expansion started. This was the strongest growth since February 2011 which had 3.33% growth. The highest growth of this cycle was 3.43% in October 2010. The faster the wage growth, the more likely the labor market is full.
The chart below gives another view of pay as it shows the year over year growth in aggregate incomes. The 5.2% growth seen in the past month is consistent with 5% nominal GDP growth. Nominal GDP growth was 4.1% in 2017. The fastest growth this cycle was 4.4% growth in 2014.
Aggregate Income Growth
Manufacturing Strong, Retail Weak
The chart below shows the 18 month change in payrolls for factories as compared with retail trade. Manufacturing has recently been very strong as it has emerged from the weakness seen in 2015 and 2016. It doesn’t hurt that Trump is gearing his economic policies to support the sector. The retail trade could be seeing weakness because the business cycle is ending. It doesn’t help that Wal-Mart, which is the largest employer in America, has recently been in the doldrums. The firm announced it closed 63 Sam’s Club locations in January.
Retail Trade Job Growth Almost Non-Existent
Conclusion
It’s important to not go overboard with the takeaways from the labor report because the shifts have been violent. The story of the labor market is that it’s maturing, but hasn’t yet eliminated all the slack (unemployed labor). At some point in the next 1-2 years, the labor market will be full. There might be a sudden drop in jobs, leading to a recession especially if the Fed raises rates too quickly. Inflation could force the Fed’s hand on rate hikes, which would be a problem.
Disclaimer: Before making any investment decision you must read and accept our full disclaimer at www.upfina.com/disclaimer


