
Original article posted by UpFina
Many bearish investors have become obsessed with being negative about stocks on the grounds that investor sentiment was at an all-time high in January 2018. You can’t blame them going against almost euphoric sentiment that existed earlier this year given that this is the 2nd longest bull market since WWII. However, bull markets are built on fear. The 2008 financial crisis is the gift that keeps on giving for this bull market because it scared investors out of stocks for years, with many of them just starting to come back. We recently reviewed how 50% of US households own no stocks. As stocks rallied higher, more retail investors have started to invest, which is the opposite of what you should be doing. If you are blindly chasing price, that can only end in disaster. What this leads is to the similar euphoria that everyone experienced in 2017 and early 2018 where seemingly everyone was bullish, a sign that the cycle could be ready to reverse. This is like how a forest fire occurs as part of the cycle of life. The burnt wildlife provides fodder for new growth.

Q1 hedge fund letters, conference, scoops etc
A Terrible Run Fuels Skeptics
Investors who have little experience may not realize how bad the previous decade for stocks was. The stock market had a great run in the 1990s as the tech bubble caused valuations to reach the highest point ever. Stocks fell about 50% from 2000 to 2002. The Nasdaq fell 78% in 30 months as the dot com stocks, which were bid up to unbelievable levels, burst. The 2001 recession and September 11th terrorist attack also hurt stocks. From 2003 to 2007 stocks rallied. This was a relatively short bull run which was ended because of the housing market crash and subsequent financial crisis. These events caused stocks to fall about 50% again. The bull market peak was only slightly above the previous one and the trough was a bit lower. This all seems like distant history now, but it isn’t. After stocks started increasing in March 2009, investors were still fearful after being battered twice within the decade.
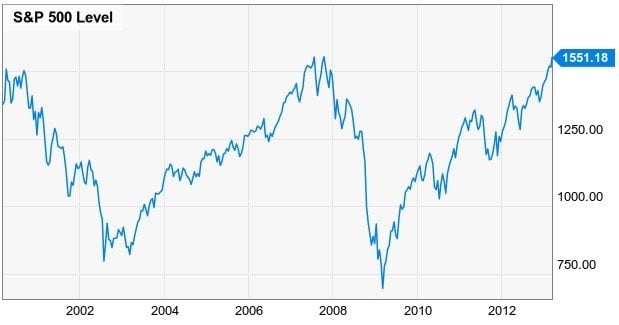
As you can see from the chart below, it took until 2013 to make new highs.
S&P 500 2000-2013
Even though stocks had done well for 4 years, the stock market had no returns over 13 years and two huge shocks. That’s a horrific Sharpe Ratio. Because of how bad the last cycle ended, some investors think stocks always return to their previous level. Because the past two cycles ended in severe drops, some investors think the next drop will be 50% or more. This skepticism still exists today as many retail investors claim they will buy stocks only after they fall 50% again. It’s certainly possible that a 50% decline will happen again at some point, but sitting on the side lines for 5 years hasn’t worked out. Furthermore, because this rally has been so strong, it would take a once in a century-type decline to get back to the 2009 low. The S&P 500 would need to fall 75% from today’s level to reach the previous bottom.
A 13 year period of a flat stock market where the bear market brings stocks to new lows is very rare. You need to go back to 1965 to 1978 to see a similar situation play out. As you can see from the chart below, the bear market in the mid-1970s brought stocks to a new low. Furthermore, stocks were about flat in this 13 year period. It’s rare stretches like these which make bull market stretches like the 1920s, the 1990s, and the 2010s possible.
S&P 500 1965-1978
Wall Street Defeats Main Street
Besides the stock market declines, the other reason investors are stubbornly bullish is because of the pain main street experienced in the last recession. Many retail investors see the recovery in stocks as fake because they have been struggling for so long. Even though the unemployment rate signals the economy appears fundamentally sound, people are still hurting. However, they are missing that going from bad to OK is great in rate of change terms. Improvement is what stocks feed off. If the labor market was experiencing enormous wage growth, it would signal the economy is near the end of the cycle. The fact that so many people became disillusioned with the labor market is exactly why this business cycle has been so long. The other reason it’s long is because growth has been slow.
The chart below is one of the principle reasons people feel the economy isn’t working.
Homeownership Rate
The homeownership rate is still historically low. In Q2 2016, the homeownership rate hit 62.9% which was the lowest point since Q2 1965. That’s the lowest percentage since this stat started being calculated. Even in Q4 2017, the homeownership rate is below its long term average. 1.36 million homes still have mortgages that are worth more than the current value of the home.
We’ve previously reviewed US housing extensively in the following articles:
- Housing: There’s Good News & Bad News
- What Comes Next For Housing Prices/Rent?
- The New Trend In Housing
- The Future of US Housing Market
- Is US Housing In A Bubble, Again?
The other area, which we’ve reviewed extensively is that the labor force still hasn’t recovered. The chart below shows the civilian labor force participation rate for those 25-54 years old. As you can see, it’s at 81.8% which is 2.8% below the peak in 1999. It’s 1.6% below the peak in 2007. The decline to 80.6% in 2015 was the lowest point since 1984. It has only been recovering for 2 years.
Civilian Participation Rate
Many investors have been fearing a 50% crash this entire bull market because stocks did poorly for 13 years and the 2008 recession was so devastating, the economy still hasn’t recovered. However, you could argue that those are actually reasons to be bullish about the future. We’ll leave you with the quote below which explains why humans are pre-disposed to fear.
Disclaimer: Before making any investment decision you must read and accept our full disclaimer at www.upfina.com/disclaimer


