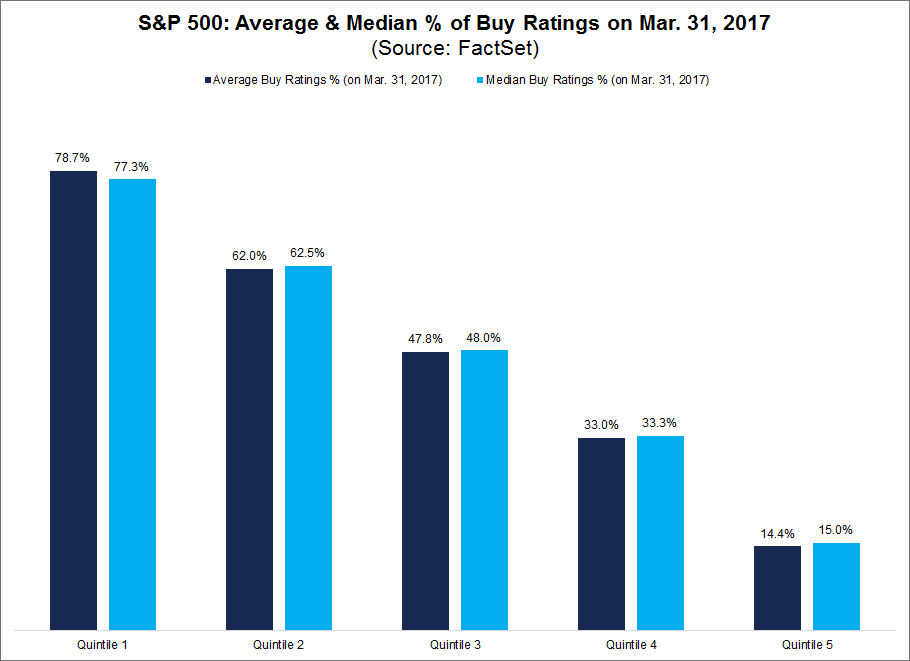
To assess the performance of analysts over the past year, FactSet divided the stocks that were in the S&P 500 on March 31, 2017 into five equal-sized groups (quintiles) based on the percentage of Buy ratings on that date. The 20% of S&P 500 companies with the highest percentage of Buy ratings were placed in the first group (Quintile 1). The 20% of S&P 500 companies with next highest percentage of Buy ratings were placed in the second group (Quintile 2). The 20% of S&P 500 companies with the lowest percentage of Buy ratings were placed in the last group (Quintile 5). FactSet then looked at the average price return and median price return for each group from March 31, 2017 through March 22 to measure performance. For companies that no longer were traded publicly as of yesterday’s close, the last available trading price was used in the analysis when available.

Identifying Outperformers
Among the top three quintiles (with the 60% of S&P 500 companies with the highest percentage of Buy ratings on March 31, 2017), it is difficult to point to one quintile as a clear outperformer. The first quintile has recorded the second highest average price return (+11.7%) and the highest median price return (+14.0%) of the five quintiles during this time. The second quintile has recorded the highest average price return (+12.1%) and the third highest median price return (+9.2%) of the five quintiles during this time. The third quintile has recorded the third highest average price return (+10.5%) and the second highest median price return (+12.6%) of the five quintiles during this time.

On the other hand, the fifth quintile (with the 20% of S&P 500 stocks with the lowest percentage of Buy ratings on March 31, 2017) has been the clear underperformer during this period. This quintile recorded the lowest average price return (+2.4%) and the lowest median price return (-1.5%) of the five quintiles during this time. The average percentage of Buy ratings for a stock in this quintile was 14.4%, while the median percentage of Buy ratings for a stock in this quintile was 15.0%.
Of the stocks in this group, Chesapeake Energy has been the weakest performer. From March 31, 2017 through yesterday, the stock price for Chesapeake Energy has decreased by 47.6% (to $3.11 from $5.94). On March 31, 2017, seven of the 36 ratings (19%) on Chesapeake Energy were Buy ratings.
Article by John Butters, FactSet


