
Guggenheim Investments high-yield and bank loan outlook for the month of April 2018, titled, “Not Too Soon to Think About Defaults and Recovery Rates.”

The current low-default environment supports near-term value in high-yield corporate bonds and bank loans. This is especially true for bank loans, which outperformed high-yield corporate bonds year to date with higher London interbank offered rates (Libor) translating into more attractive floating coupons. However, investors should not assume that the benign credit backdrop will exist indefinitely. Our research suggests that at around 3 percent, short-term rates will pressure corporate borrowers’ ability to pay debt service on existing liabilities. It would not take many corporate defaults to push the trailing default rate higher, evidenced by the impact of iHeartMedia’s skipped interest payment on the leveraged loan default rate this quarter.
Unlike the last recession, which featured unsustainable levels of household debt, we believe that the next downturn will be traced back to the corporate debt market. U.S. corporate liabilities stand at an all-time high of 100 percent of gross domestic product (GDP), exposing the economy to a rise in corporate borrowing costs and/or a decline in corporate earnings. Given that credit investors cannot avoid defaults with 100 percent certainty, a prudent next step is to focus on minimizing loss-given defaults, and maximizing recovery rates. In this report, we discuss why investors should insulate portfolios from credit losses by investing in secured debt and by avoiding companies that have defaulted in the past.
Report Highlights
- As the Federal Reserve (Fed) tightens monetary policy further, we expect to see default rates higher next year.
- Loan recovery rates averaged 70 percent between 1990 and 2017 as a result of their secured status and seniority in the capital structure. Senior secured bond recovery rates averaged 58 percent over the same period, while senior unsecured bond recovery rates averaged 43 percent.
- We are concerned about distressed exchanges as the risk of re-default is high. About 7 percent of high-yield corporate bond issuers have defaulted in the past.
Leveraged Credit Scorecard
As of 3.31.2018
Macroeconomic Overview
Too Little, Too Late
As we enter the ninth year of the current expansion, it is hard to be optimistic about the impact of corporate tax cuts. On one hand, they represent a net credit positive in the near term, boosting corporate profits and after-tax cash flow, and might help lengthen the duration of the cycle a bit. On the other hand, the longterm benefits are likely to be modest at best, especially if the windfall is spent on share buybacks and special dividends rather than additional capital spending. Our greater concern is that the substantial late-cycle fiscal easing in the pipeline increases the risk that the economy will experience a boom-bust cycle that ends in a recession.
With the unemployment rate at 4.1 percent and core inflation rising, fiscal policy should be leaning against the economy to prevent overheating, not providing further stimulus. Instead, the combination of tax cuts and increased federal spending will push the unemployment rate further below its sustainable level, boost wage pressures, and push inflation above the Fed’s 2 percent objective.
Faster wage growth, rising core inflation, and an unsustainably low unemployment rate underpin our longstanding view that the Fed will raise interest rates four times in 2018. Fed funds futures show the market is now pricing in three rate hikes for 2018, up from two at the beginning of the year, which contributed to a pickup in first-quarter market volatility. The Chicago Board Options Exchange SPX Volatility index (VIX) spiked to as high as 37 intra-quarter, its highest closing level since August 2015, and ended March 60 percent above its one-year average. Meanwhile, corporate bond spreads widened from post-crisis lows and implied interest rate volatility rose sharply.
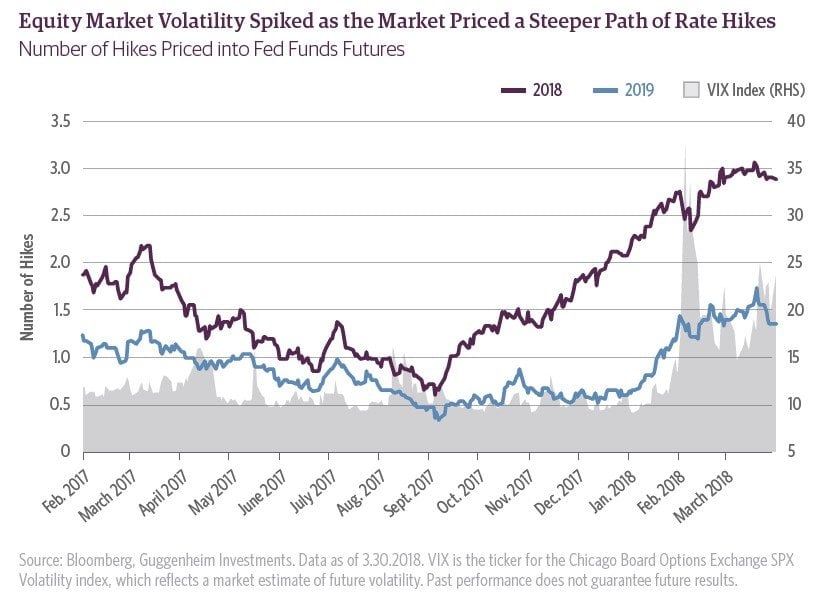
Markets are right to be nervous about a steeper hiking path than previously anticipated, as tighter monetary policy will sow the seeds of the next recession. While fiscal policy will boost GDP growth in 2018 and 2019, by 2020 the fiscal impulse will fade, turning instead to a modest drag on growth. By that time monetary policy will be meaningfully tighter, with the fed funds rate climbing as high as 3.50 percent by the end of 2019 and the Fed’s balance sheet likely to have shrunk by close to $800 billion. Tighter fiscal and monetary policy, along with rising policy uncertainty ahead of the 2020 presidential election, will likely prove to be too much for an overextended economy to bear. Our recession probability model and recession dashboard continue to point to the next downturn beginning sometime in late 2019 through mid-2020.
Further complicating the story is the risk of a global trade war sparked by protectionist actions taken by the Trump administration. We now have steel and aluminum tariffs in place that are likely to have some modest inflationary impact while hurting almost 20 percent of U.S. companies, according to our estimates. On April 3, President Trump set off another trade skirmish when he announced the imposition of tariffs on $50 billion of Chinese imports, which prompted China to retaliate on April 4 by imposing tariffs on $50 billion of U.S. goods. We expect more protectionist trade and investment policies in place by year end.
In the near term, strong economic data indicate to us that the U.S. economy is on solid footing. But with monetary and fiscal policies on a collision course, risks of a turn in the credit cycle are rising. As corporate credit spreads offer meager compensation for these risks, investors should move toward a more defensive stance. We highlight some ways to do that in this report.
First Quarter 2018 Leveraged Credit Performance Recap
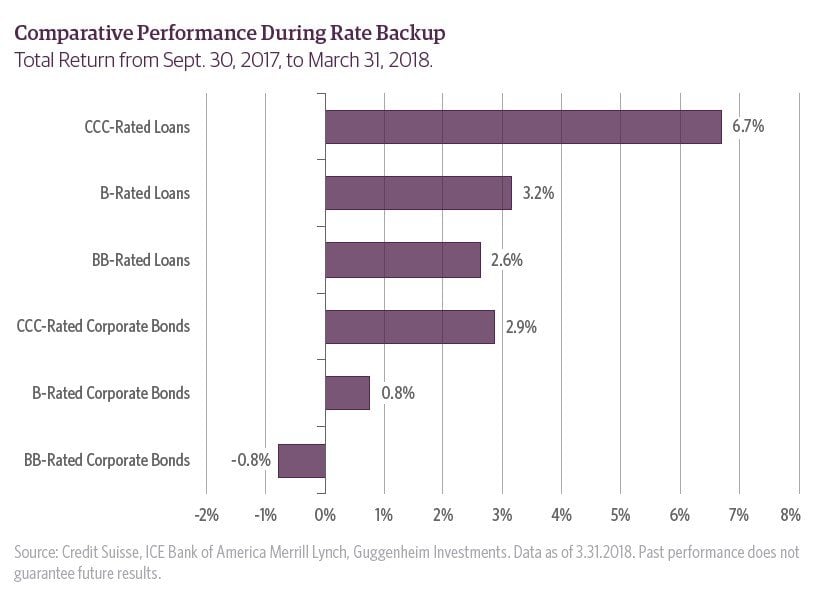
The relative performance of high-yield bonds and leveraged loans in first quarter 2018 highlights the fact that fixed-rate credit is not immune to duration-driven selloffs. The ICE BofA Merrill Lynch High-Yield index posted a 0.9 percent loss on a total return basis, as higher-duration BB-rated bonds delivered their worst performance since third quarter 2015 with a 1.7 percent loss, compared to a 0.4 percent loss for B-rated bonds and a 0.5 percent gain for CCC-rated bonds. On the other hand, floating-rate leveraged loans appeared immune from this backup in yields. The Credit Suisse Leveraged Loan index posted gains across all ratings. On average, leveraged loans returned 1.6 percent for the quarter, with CCC-rated loans delivering the strongest gains of 3.6 percent, compared to 1.2 percent for BB-rated loans and 1.6 percent for B-rated loans.
Since 10-year Treasury yields began to move higher in early September 2017, BB-rated bonds have returned -0.8 percent, the only rating category in leveraged credit to record a loss over this period. We view B-rated credits relatively favorably in the current environment, as they balance credit and duration risks and offer wider spreads compared to their own history than other rating categories. Between high-yield bonds and bank loans, we believe that bank loans offer the better value proposition in a Fed tightening cycle. BB-rated bank loans returned 2.6 percent over the same period of rising rates, and returns were higher for B-rated and CCC-rated loans. The floating-rate coupons of bank loans make them less vulnerable to the backup in rates. Investors recognize this, and flows have shifted accordingly. Bank loan mutual fund and exchange-trade fund (ETF) net inflows stand at $2.9 billion year to date, compared to almost $16 billion in net outflows for high-yield mutual funds and ETFs.
The rapid rise in Libor has drawn widespread attention. Since the beginning of December 2017, three-month Libor has risen from 1.5 percent to 2.3 percent, or a cumulative 80 basis point increase when the Fed has only delivered two 25 basis-point hikes over this period. This means that loan market coupons are rising, but it also suggests that the spread between Libor and other short-term funding measures is widening. Generally, markets look at the spread between three-month Libor and the three-month overnight-index swap rate (OIS) for a gauge of bank funding pressure. In non-distressed environments, we would expect to see this spread between 10–20 basis points. In more distressed environments, such as 2011 and 2016, we have seen Libor-OIS widen to 42 basis points, on average.
No other widening environment compares to 2008, when in the midst of the liquidity crunch Libor-OIS widened to more than 350 basis points. As of the end of the first quarter of 2018, the Libor-OIS spread was at 59 basis points, the widest since 2008.
A number of factors are contributing to a wider Libor-OIS spread, but we do not believe it is related to bank credit concerns. One driver is increased Treasury bill issuance. The Treasury debt management office has increased the supply of bills outstanding by nearly $330 billion year to date and by roughly $500 billion over the past year as a result of a larger deficit, reduced demand for Treasurys from the Fed, and a need to increase the Treasury cash balance. This caused roughly 20 basis points of cheapening in T-bills relative to OIS, which is spilling over into the unsecured bank funding market. Another driver may be spillover from the combination of the Fed raising interest rates and reducing the size of its balance sheet. The increase in Libor has also been exacerbated by the looming repatriation of offshore corporate cash, which has reportedly caused a reduction in offshore investor demand for three-month bank commercial paper and certificates of deposit.
While three-month Libor now sits at 2.3 percent, markets continue to price a higher path on the forward curve. Libor is expected to rise to 2.9 percent by the end of 2019. This should appeal to loan investors who could simply clip higher coupons in a low-default environment, but we do not expect the low-default environment to continue forever. Our internal debt-to-GDP model suggest that short-term rates at 3 percent would hinder corporate borrowers’ ability to pay back existing debt. We expect defaults will be higher by 2019 if borrowing costs continue to rise. Already, the 12-month trailing par-weighted default rate for leveraged loans has increased from 1.6 percent at the end of 2016 to 2.0 percent by the end of 2017, and most recently at 2.4 percent as of the end of March 2018, according to S&P LCD. The par-weighted default rate for high-yield corporate bonds continues to fall and was most recently only 1.4 percent.
We view this as an opportune time to discuss recent default and recovery trends, in light of the recent liquidation announcement of Toys “R” Us, the major default of iHeartMedia, and our cautious view on the economy over the next two to three years. These trends are likely to come more into focus over the next couple of years as defaults edge higher due to borrowers feeling the squeeze from tighter monetary policy. The next section provides some recommendations on how to potentially protect portfolios from credit losses in an environment where defaults are rising.
Strategies for a Higher Default Environment
We have highlighted in past reports ways that investors can look for signs of default risk before it is priced into the market. Those signs would surface from fundamentals, including the issuer’s total leverage as a ratio to earnings, interest coverage measured by annual cash generation to annual interest expense, and a second measure of interest coverage based on cash on the balance sheet relative to annual interest expense. A company with a healthy level of cash has a second source to draw from if it is not generating enough free cash flow to pay ongoing interest payments, although that lifeline is a short one. For companies with near-term debt maturities, it is important to ensure that cash on the balance sheet can satisfy debt repayment in the event that the debt cannot be rolled over.
While credit investors can take steps to avoid defaults, they can never be 100 percent certain that default risk has been eliminated. Even companies originally rated investment-grade have defaulted in the past. Beyond fundamental credit analysis, the next step is to select structures that may offer the best protection in the event of a default. History shows that investors should focus on senior secured debt, avoid issuers that have defaulted in the past, and focus on high-quality assets that retain value if they need to be liquidated.
According to Moody’s, the average recovery rate on defaulted first-lien loans was 70 percent between 1990 and 2017 because they tend to be secured by assets and are senior in the capital structure to other forms of debt. Senior secured bond recovery rates averaged 58 percent over the same period, while senior unsecured debt recovery rates averaged 43 percent. For this reason, we believe investors should favor bank loans and secured bonds in the current environment. Fortunately, the ratio of secured loans to high-yield corporate bonds outstanding has grown from 47 percent in 2010 to 56 percent currently, giving leveraged credit investors a larger opportunity to invest in loans. They will face competition from collateralized loan obligations, which have doubled in market size since 2010.
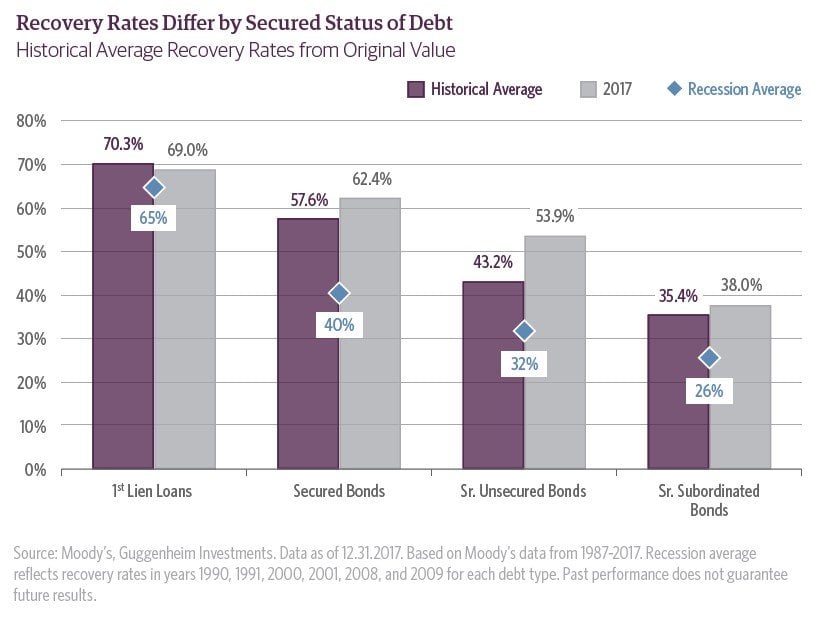
As our chart shows, the average recovery rate during a recession tends to be lower than the historical average for all levels of debt seniority and security. We have found this to be a consistent pattern in each of the past three recessions. This is a macro input that we use to estimate future recoveries. In a recession, we believe recovery rates would approximate their historical recession average.
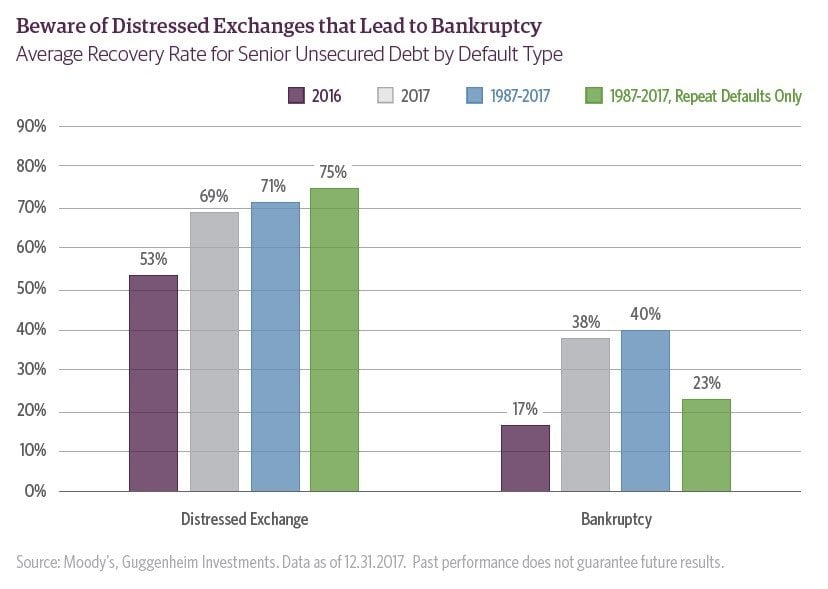
In 2016, recovery rates were depressed despite no U.S. recession. One explanation is that a larger share of defaults in 2016 were bankruptcies rather than distressed exchanges. Historical recovery rates for bankruptcies are only 40 percent, compared to 71 percent for distressed exchanges, and that trend generally holds each year. Therefore, in a non-recessionary environment in which there are more distressed exchanges than bankruptcies, we would expect higher-than-average recovery rates. However, we caution investors from being misled by recovery trends in distressed exchanges. In the long run, the data suggest that companies that have undergone a distressed exchange carry meaningful re-default risk, and recoveries are lower in a second default.
In a typical distressed exchange, unsecured debt is swapped for secured debt at a lower value. The borrower owes less, and the lender receives a higher payment priority in the event of another default. The new haircut value is a rough estimate for the recovery rate in that default because lenders have retained some value of their original debt outstanding. For example, if the outstanding debt is reduced to 80 percent of the original value, then the recovery rate would be roughly 80 percent (a loss of 20 percent).
According to Moody’s, over half of distressed exchanges from companies in oil exploration and production over the past couple of years filed Chapter 11 bankruptcy within a year of completing out-of-court restructuring. Over a longer horizon (1987–2017), 41 percent of distressed exchanges have eventually led to another default. Of those repeat defaults that Moody’s reviewed, 87 percent were bankruptcies, which on average recovered 83 percent for bank debt, 23 percent for senior secured and 15 percent for subordinated bonds. Our takeaway from this study is that when the second default event is a bankruptcy, an investor would not want to be left holding any unsecured debt.
Given the relatively high risk of re-default following a distressed exchange, we believe investors would be better off avoiding companies that have already defaulted in the past unless their financial status shows significant improvement via healthier interest coverage or much lower debt relative to earnings. Out of $1.7 trillion of originally rated high-yield corporate bonds outstanding, we found that 7.3 percent have defaulted at some point within the past seven years, or 79 out of 958 issuers (8.2 percent). We will continue to monitor the share of companies that have defaulted in the past.
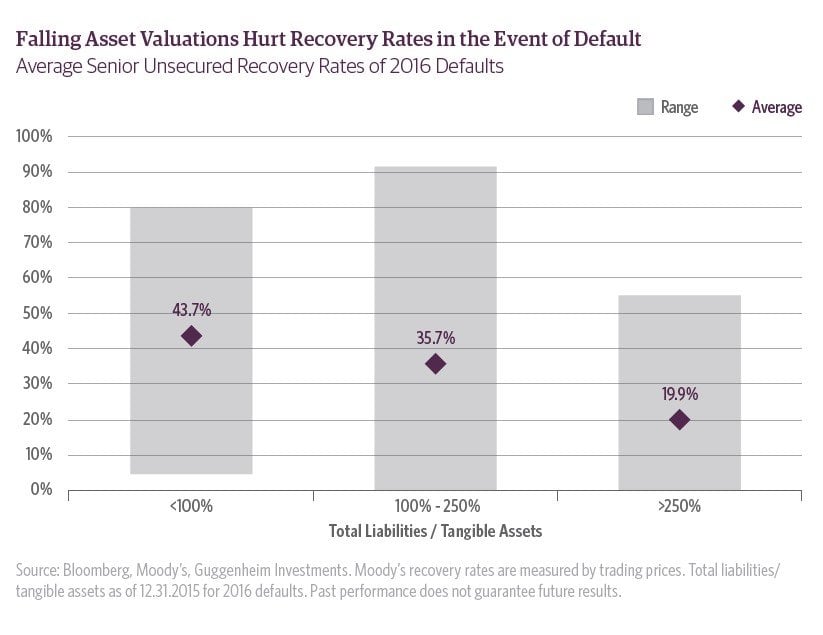
Our review of 2016 defaults also found a relationship between recovery rates and the ratio of liabilities to tangible assets, though inconsistent for every company. Senior unsecured recovery rates of companies with less than 100 percent total liabilities to tangible assets were in line with the historical average at 44 percent, while recovery rates for companies with greater than 250 percent liabilities to tangible assets were less than 20 percent, on average. This relationship suggests that recovery rates would be strained when assets are declining. We believe this explains why recovery rates are generally lower during recessions, and were low in 2016. On average, the aggregate value of assets in the S&P 500 has fallen by 6.6 percent during the last three recessions. They fell even more if we look specifically at the troubled industry during each recession (commercial real estate in the 1990 recession, technology and telecommunications in the 2001 recession, real estate and banking during the 2008–2009 recession). In 2016, the value of assets in the energy industry fell by 5.6 percent due to asset write-downs from U.S. oil and gas companies that shut down production and the rapid liquidation of assets from bankruptcies. While we had no U.S. recession, the value of assets in the affected industry fell, mirroring the behavior of asset valuations in a recession, and in turn depressed recovery rates.
Outlook and Investment Implications
In 2018 and 2019, we expect recovery rates will be close to, if not slightly better than, the historical average. The value of corporate assets grew in 2017 across all industries, lifting recovery rates as well. We expect real growth in the U.S. economy to average 3 percent in 2018 and 2019, which should translate into stable or growing corporate assets. Though difficult to foresee, outside of retail we do not expect a major industry-specific crisis that we saw in 2015 and 2016. The risk of retail posing a large economic drag is much smaller than the risk posed by commodity industries in 2015 and 2016. The clothing and general merchandise industry represents less than 3 percent of U.S. nonfinancial corporate assets, compared to 10 percent for commodity-related industries in 2015. Of course, there could be spillover effects into other sectors, such as commercial real estate.
Given our view that the next U.S. recession will likely come in late 2019 to mid-2020, we believe macroeconomic factors will be key drivers of recoveries two years from now. Consistent with past recessions, we would expect recovery rates to fall by approximately 10 percentage points in 2020 and 2021, averaging 32 percent for senior unsecured debt. In a recession, we would expect loan recovery rates to be 60–65 percent of par, which is 5–10 percentage points below their long-term historical average.
As we increasingly focus our reports on risks, we want to emphasize that our team continues to find opportunities in both high-yield corporate bond and bank loan markets. Our goal is to draw attention to some of the trends that help us uncover ways to shift to a more defensive stance in a credit portfolio as we near the end of the credit cycle without fully giving up the value proposition in leveraged credit.
As we have emphasized in past reports, there is no better strategy than to take a careful credit-by-credit approach in high-yield markets, especially as we near the end of the cycle. This approach continues to uncover a broad range of opportunities in various sectors, including in finance/banking, industrials, some consumer cyclical services companies, and in metals and mining.
Article by GuggenheimInvestments.com.
See the full PDF below.


