Forge First commentary for the month ended March 31, 2018.
It’s no secret that the first quarter of 2018 has experienced significantly more volatility compared to the steady and complacent rise in market indices in 2017. Fears surrounding how many more times the Fed will hike interest rates in 2018 and what that will do to the yield curve, concerns over Trump trade wars, and data privacy issues for “FANG” stocks caused the S&P 500 to encounter its first 10% correction since January 2016 and end its streak of nine quarterly wins, losing 0.8% for the first quarter of 2018. Our closely correlated TSX index lost 4.5% on a total return basis this quarter, making it only the 77th-best performer among its 93 global peers year-to-date.
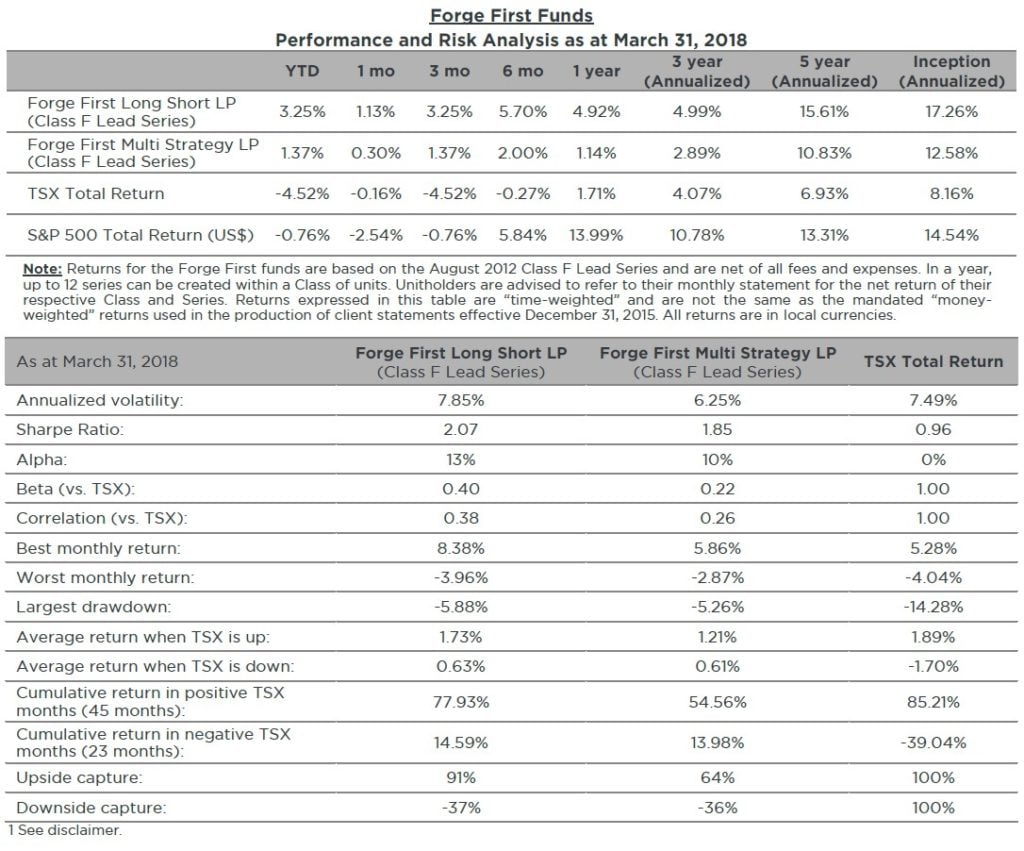
Our style of long/short investing has served our investors well during the last three months, with each of our funds, Forge First Long Short LP (“FFLSLP”) and Forge First Multi Strategy LP (“FFMSLP”), generating positive net returns in every month so far this year. Please continue reading to get more insight into our macroeconomic view, recap on our funds, and to learn how long/short strategies can reduce volatility in investor portfolios.
Macroeconomic Commentary
Since late 2017 we’ve presumed that the collective impact of the following combination of factors during the back of 2018 could cause equities to enter a bear market somewhere between late 2018 and 2019:
- rising front end interest rates,
- the flattening yield curve,
- shrinking Central Bank balance sheets,
- declining trajectory in the trend line of global growth,
- the deceleration in forward EPS growth given the lapping of Trump’s tax cuts, and
- the slowdown from gargantuan share buybacks
Similarly as discussed in this February 2018 McCreath’s Macro Musings, we believe US equities have a decent shot at getting back to late January highs, however the road to get there is now even rockier.
On the positive side of the ledger is earnings growth. The additional year-to-date decline in the US dollar, strong oil prices and record buybacks are likely to bolster already robust tax cut-driven profit outlooks for S&P 500 companies during Q1 reporting season that starts late next week. Consequently, recent market action has catalyzed a growing divergence between S&P 500 forward earnings and the index’s forward P/E. However, negative trade headlines and mixed data on growth over the past month have served to muddy the waters for equity bulls.
As promised, Trump is showing his protectionist stripes, along the lines of Hoover and especially Reagan. Ironically it was during April 1987 that President Reagan imposed a 100% tariff on Japanese computers, TVs and power tools after he declared that Japan wasn’t living up to a 1986 trade deal in semiconductors. This time the target is China, but technology remains the target. Let’s hope Trump doesn’t take these trade spats as far as Hoover took them. Back in 1929, Hoover signed the Smoot-Hawley Tariff into law, crushing the stock market and triggering the Great Depression.
Also, now we have NAFTA negotiations to consider, about which Canada’s TSX appears to have been very blasé. Like the markets, we presume a palatable deal will get done, but it would seem intuitive that if a deal doesn’t get done, the incremental uncertainty is the last thing needed by the Canadian economy.
January’s GDP data suggests that Canadian Q1 growth will be lucky to print at 1%. South of the border, it’s looking as if a 2% growth rate could be a stretch for the American first quarter as year-to-date personal income and spending data have missed expectations.
Combine that with investor positioning, it’s little wonder that yields on 10 and 30 year government bonds have pulled back from recent highs. Interestingly though, this downdraft has almost entirely been attributable to a decline in real yields vs break-evens. As discussed in February’s “McCreath’s Marco Musings”, US wages are poised to inch higher, as are the prices of non-energy imports.
Figure 1 shows the overall participation rate for the US work force, the data point we always hear about, along with that same rate for the key 24-54 year-old demographic. Note the significant increase in work force participation of the generation X and Y demographic. It’s only a matter of time until wages inch higher.
Meanwhile, Figure 2 confirms the positive correlation between a declining trade-weighted US dollar, shown inverted on a 3 month rate of change, annualized basis, lagged 12 months vs the change in non-energy US import prices. Similar to wages, it’s only a matter of time until imports push the FOMC’s favoured measure of inflation, PCE Core, higher.
Compounding these uncertainties, QT (quantitative tightening) is set to ramp to $90B in Q2 from $60B in Q1 and just $30B in Q4 2017. While the Fed was hoping to just watch paint dry, things don’t necessarily work that way when it comes to reducing a balance sheet that quintupled over a 10 year period.
Our view remains that exiting Powell’s June press conference, along with another 25 basis point rate hike, markets will begin to price in a fourth hike for 2018. The biggest risk to this forecast is that if the economic data continues to be soft-ish, then it may cause the Fed to back off of this narrative. This is certainly something we are keeping a very close eye on with regards to the Forge First portfolios.
Portfolio Commentary
During the month of March, we reduced the net long exposures in both FFLSLP (48% net long at the end of February to 40% net long at the end of March) and FFMSLP (36% net long to 32% net long) as we added additional protection to hedge the portfolios from further market volatility.
In fact, we are pleased to report that both funds generated positive returns from their respective long and short positions during March. March performance was driven in part by long positions in our energy basket (a sector we have been positioned correctly on for the last several months while oil has been the best performing asset class during the first quarter) as well as short positions in sector and index ETFs (including long positions in various put options) and in individual securities such as Enbridge (ENB.CA), Transat (TRZ.CA), TransCanada Corporation (TRP.CA), Canadian Western Bank (CWB.CA), and CI Financial (CIX.CA). We continue to be long ZCL Composites (ZCL.CA) as one of our top positions in each of the two funds, a strong dividend growth and free cash flow story, along with select energy names that we have done extensive fundamental analysis on and continue to see considerable value.
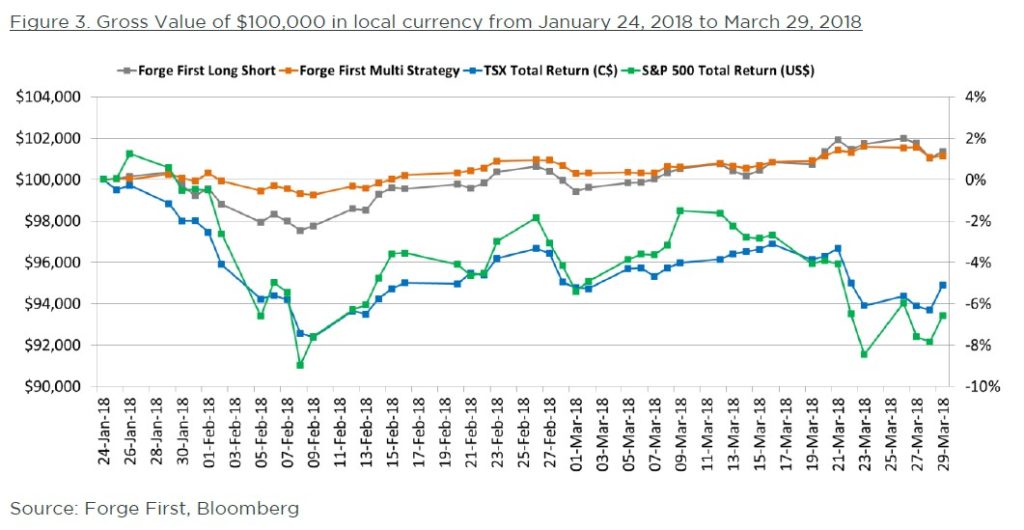
Our portfolios continue to be diversified and focused on taking long positions in individual securities that have high free cash flow and taking short positions in individual securities with high cash burn, all the while adding a layer of portfolio insurance via shorting large cap index and sector ETFs and utilizing defensive options strategies. Our shorting strategy has been paramount to not only preserving capital for unitholders but generating alpha as well. As can be seen from Figure 3, the end result has been lower volatility and positive net returns for our investors during a difficult two months for long-only investors.
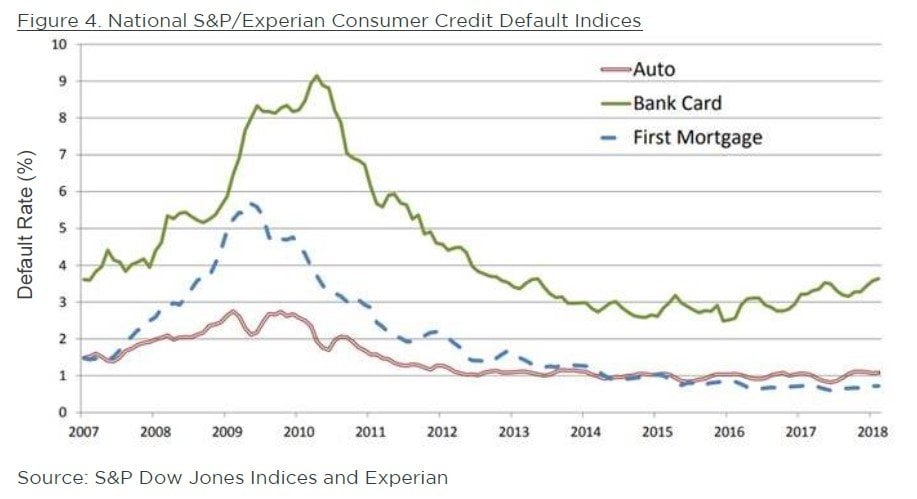
This month we’d like to highlight a short theme that we have begun to include in our portfolios. Given where we believe we are in the business cycle, about six months ago we began paying closer attention to loan delinquencies and credit card delinquencies. To our surprise, we found that US credit card defaults had bottomed in December 2015 and what’s more, we are currently in the midst of an impressive streak of fifteen consecutive months of bank credit card default rates higher than year-earlier levels. Now, maybe it’s nothing; coming off a low base perhaps this is to be expected. Call us critical but we think this looks like the early stages of a legitimate trend, particularly considering the interest rate hiking cycle that began (surprise!) on December 16, 2015 and began picking up steam...you guessed it, fifteen months ago in December of 2016. The green line in Figure 4 highlights the trend.
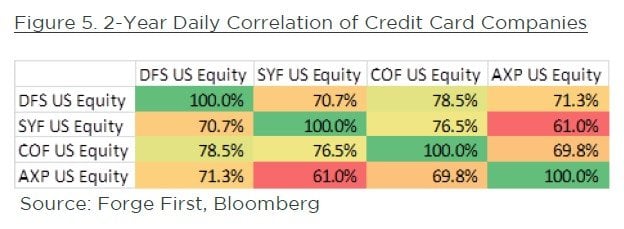
Given that this felt like something that could mutate into a legitimate problem, we were then left to dig into which companies will give us the most torque if we’re right. After an exhaustive search we decided on a basket of Discover Financial (DFS.US), Capital One (COF.US) and American Express (AXP.US). Each have their merits as a standalone short, but given their correlations to one another (Figure 5), we can significantly reduce the single stock risk by shorting a basket. As you can see Synchrony (SYF.US) didn’t make the cut as their business model of being a retail private-label card issuer made them a unique story within the group.
Of the major US banks, Capital One has the distinction of having the highest percentage of their loan book made up of credit card loans. What’s more, 34% of the borrowers in Capital One’s credit card portfolio and 49% of those in their auto loan portfolio have a FICO score of less than 660, indicating that many borrowers may be coming to Capital One as a last resort. Amongst other things, this gives Capital One the highest earnings sensitivity to provisions for credit losses (PCLs). Put another way, their earnings are the most negatively levered to credit losses of any of the companies we found.
Discover Financial and American Express are both firmly entrenched in the hyper competitive credit card marketplace with an important differentiator from companies like Visa (V.US) - which the funds are long - and Mastercard (MA.US), they take credit risk. Whereas Visa makes their money solely on spend and fee revenue, 81% and 25% of Discover and Amex’s respective business comes from their net interest income. This opens them up to the obvious risks associated with rising defaults that Visa is not otherwise exposed to. Each have unique trading characteristics that make them appealing as shorts and all possess a higher beta than the S&P 500 financials index while American Express actually has a higher negative beta than it does positive (participates more to the downside than the upside) – this is likely because it trades 3 turns higher on a P/E basis than Capital One and 4 turns higher than Discover Financial.
This trade has worked very well since we put it on a couple weeks ago and we believe we’ve identified a unique sub-sector of the financials that should underperform the broader financial index should the credit market continue to show the strains we have identified here.
Conclusion
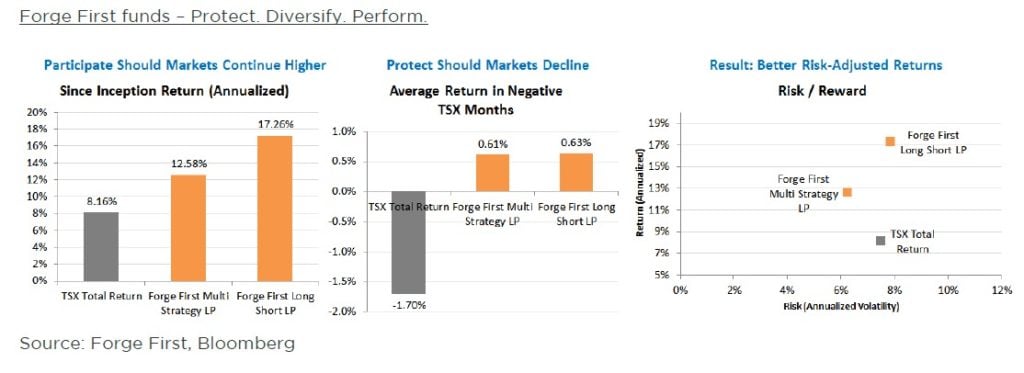
To summarize, markets are beginning to consider many of the factors that were largely ignored during 2017, and we’d encourage investors to look more closely at their current asset mix. After 9 years of a bull market in equities and as markets transition to quantitative tightening from years of easing, the case to own alternatives has never been stronger. According to Goldman Sachs, the S&P 500 realized volatility was 6.8 in 2017 and has nearly tripled to 20.3 thus far in 2018. They believe that “a shift towards risk reduction and expectation of higher volatility is likely to change the trading dynamics in 2018 and increase the value of time spent on hedging”. Of course we could not agree more! Investors should be considering long/short strategies to participate if markets grind higher and protect capital should markets decline. As we’ve stated in the past but for those not familiar with our strategies, Forge First offers solutions that have a history of generating positive returns in down markets, low correlations to equity indices, and index-beating performance since inception.
See the full PDF below.


