
Original article at UpFina
Price inflation increased in the January CPI report and the average hourly earnings from the labor report came in hot. This combination caused economists and analysts to start making projections for inflation to trend higher in 2018. This is just like how investment banks raised their 2018 year end S&P 500 forecasts after stocks rallied in the first 3 weeks of the year. That was laughable because nothing fundamental changed. The only thing that happened is stocks moved up. Forecasters were deathly afraid of being bearish on stocks for the year, so they changed with the market. As you can see, many forecasts tell you more about the past than they tell you about the future.
Check out our H2 hedge fund letters here.
The February CPI report and labor report were the opposite of the January reports as the average hourly earnings growth decelerated from 2.8% to 2.6%. The month over month CPI was up 0.2% which was much less than January which saw 0.5% growth. The core CPI was up 1.8%. It’s questionable if the Fed should be raising rates so quickly if the core CPI isn’t at the Fed’s target of 2%. Keep in mind, that the Fed’s favorite inflation metric is core PCE which is usually lower than the core CPI, meaning inflation isn’t at the target.
Not Just Wireless Seeing Disinflation
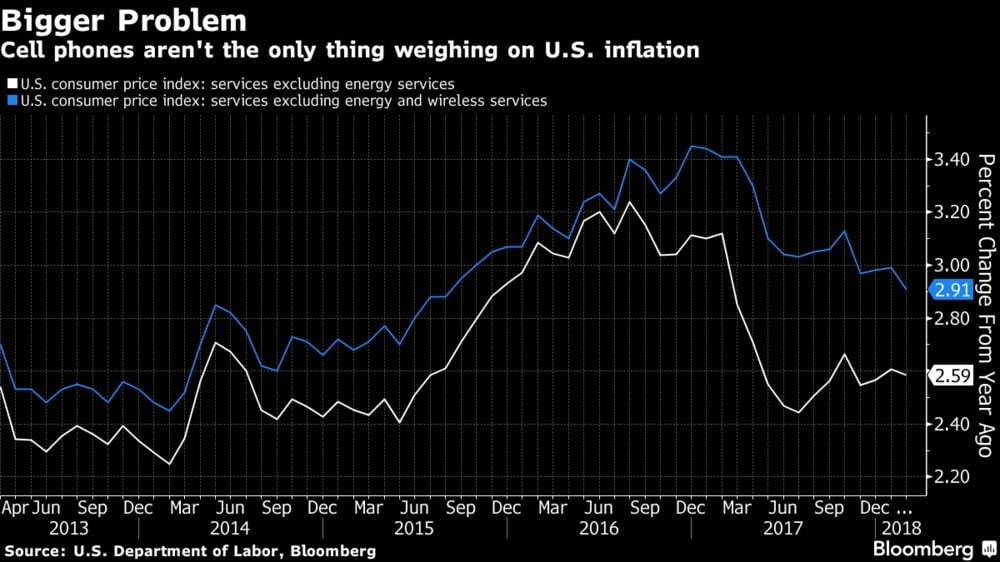
Last year, Yellen raised rates 3 times despite low inflation because she said wireless price declines were the temporary catalyst for the disinflation. However, the results don’t look so temporary. As you can see from the chart below, the inflation excluding wireless and energy is higher than the inflation which only excludes energy because wireless prices still are weighing on inflation. The difference is 32 basis points.
Wireless Disinflation Still A Thing
Even though the two metrics have merged a bit from 2017, the trend isn’t what Yellen predicted. She stated the metrics should converge because the inflation in wireless services would increase, but instead the inflation in the other products have come down to where wireless is at. The disinflation may not have been as transitory as Yellen expected. When growth and inflation miss Fed forecasts, the Fed becomes too hawkish.
Problematic Analysis
It’s important to not only show the data which agrees with our points, but also show why the data which disagrees with us is faulty. The chart below shows the 12 month, 6 month, and 3 month annualized inflation changes. Using an annualized inflation metric which looks at 6 month over 6 month and quarter over quarter results is mathematical gymnastics. It’s probably better to just look at the 6 month over 6 month change and the quarter over quarter change without annualizing the result. The chart below speaks for itself.
Annualizing Gone Awry
The green line is incredibly volatile. It often shows extreme results which aren’t in tune with the year over year change. To be clear, the year over year change isn’t altered since it’s already annualized. Since the data comes out each month, we think the best time frames to look at are seasonally adjusted month over moth data and year over year data. As we mentioned earlier, those metrics weren’t that impressive in the February report.
We’re also going to explain why the NY Fed’s UIG estimate might be off. As you can see from the chart below, the prices only gauge fell from 2.18% to 2.17% in January. It is close to the CPI inflation metric.
NY Fed UIG Leans Too Much On Survey Data
The underlying inflation gauge full data set measure has been the indicator which has gained the most attention in the past few months because it shows inflation is higher than what the CPI suggests. As you can see, it is at the highest in 11 years as it went from 2.94% to 3% in January. The latest reading is said to be up principally because of manufacturing and non-manufacturing survey data. Sometimes great indicators can be led astray if the data used in them is off. For example, the leading indicators data is manipulated by the jobless claims which clearly doesn’t represent the labor market as there isn’t accelerated wage growth despite the jobless claims to labor force ratio being at its record low. In this case, the survey data might be overestimating inflation. The regional Fed data and ISM reports have prices paid going off the charts, but the CPI report doesn’t show much inflation. This disconnect leads the UIG to overestimate where inflation will be.
Summary Of Inflation
Shelter is 41.8% of CPI, so it’s movement goes a long way in determining where the overall number will go. As you can see in the chart on the bottom left, the shelter CPI is decelerating on a year over year basis.
Summary Of Inflation
The rental vacancies are used as a leading indicator for shelter inflation because lower vacancies means the supply isn’t meeting demand. This could mean a pick up in price inflation later this year. The breakeven inflation rate has only increased modestly as the increase in real rates has mostly driven the rise in treasury yields. Both the long leading index for core CPI and the short leading index for headline CPI have inflation staying in the range it has been in throughout this expansion. The question investors are reviewing is if the economy is in a new normal where inflation will accelerate above the Fed’s target. If it doesn’t, stocks should do well because the Fed won’t raise rates 4 times in 2018. As we mentioned, there’s a risk the Fed ignores reality and raises rates quickly anyway. That will invert the yield curve and cause a recession.
Conclusion
Because of the tepid CPI report, we re-examined the inflation thesis. The surveys and estimates might be a bit overzealous since the consumer prices index excluding wireless and energy ticked down again, renewing the disinflationary trend. We aren’t overreacting to one data point. Instead, we are saying that price inflation will increase, but more modestly than current inflation expectations, because the forecasters overreacted to the January reports, akin to what happened with stock analysts raising 2018 year end price targets following the rally in January. As a reminder, a very important metric to analyze is inflation expectations, and not necessarily inflation itself, which we discuss in more depth in “Correlation/Causation with Interest Rates, Inflation, and Stocks” and “Gold vs Inflation: Not What You Expect.”
Disclaimer: Before making any investment decision you must read and accept our full disclaimer at www.upfina.com/disclaimer


