With the stock down -30.8% over the last year, investors may be tempted to buy shares of Hecla Mining Company (NYSE: HL). In this article, I am going to calculate the fair value of Hecla Mining by forecasting its future cash flows and discounting them back to today’s value. Value investors may find the results from my analysis surprising.

DCF Methodology
The basic philosophy behind a DCF analysis is that the intrinsic value of a company is equal to the future cash flows of that company, discounted back to present value. The general formula is provided below. The intrinsic value is considered the actual value or “true value” of an asset based on an individual’s underlying expectations and assumptions.
Cash flows into the firm in the form of revenue as the company sells its products and services, and cash flows out as it pays its cash operating expenses such as salaries or taxes (taxes are part of the definition for cash operating expenses for purposes of defining free cash flow, even though taxes aren’t generally considered a part of operating income). With the leftover cash, the firm will make short-term net investments in working capital (an example would be inventory and receivables) and longer-term investments in property, plant and equipment. The cash that remains is available to pay out to the firm’s investors: bondholders and common shareholders.
I will take you through my own expectations for Hecla Mining as well as explain how I arrived at certain assumptions. The full analysis was completed on Tuesday, March 27. An updated analysis using real-time data can be viewed in your web browser at finbox.io's Hecla Mining DCF analysis page. The steps involved in the valuation are:
1. Forecast Free Cash Flows
- Create a revenue forecast
- Forecast EBITDA profit margin
- Calculate free cash flow
2. Select a discount rate
3. Estimate a terminal value
4. Calculate the equity value
Step 1: Forecast Free Cash Flows
The key assumptions that have the greatest impact on cash flow projections are typically related to growth, profit margin and investments in the business. The analysis starts at the top of the income statement by creating a forecast for revenue and then works its way down to net operating profit after tax (NOPAT), as shown below.

From NOPAT, deduct cash outflows like capital expenditures and investments in net working capital and add back non-cash expenses from the income statement such as depreciation and amortization to calculate the unlevered free cash flow forecast (shown above).
Create A Revenue Forecast
When available, the finbox.io’s pre-built models use analyst forecasts as the starting assumptions. To forecast revenue, analysts gather data about the company, its customers and the state of the industry. I typically review the analysts’ forecast and modify the growth rates based on historical performance, news and other insights gathered from competitors. Note that if a company only has a small number of analysts giving projections, the consensus forecast tends to not be as reliable as companies that have several analysts’ estimates. Another check for reliability is to analyze the range of estimates. If the range is really wide, it may be less accurate.
Hecla Mining Company, together with its subsidiaries, discovers, acquires, develops, and produces precious and base metal deposits worldwide. The company offers zinc, lead, and bulk flotation concentrates to custom smelters and brokers; and unrefined gold and silver bullion bars to precious metals traders. It owns 100% interests in the Greens Creek mine located on Admiralty Island, Alaska; Lucky Friday mine located in northern Idaho; Casa Berardi mine located in the Abitibi region of northwestern Quebec, Canada; and San Sebastian mine located in the state of Durango, Mexico. Hecla Mining Company was founded in 1891 and is headquartered in Coeur d'Alene, Idaho. Analysts covering the stock often compare the company to a peer group that includes Coeur Mining, Inc. (NYSE: CDE), Pan American Silver Corp. (NASDAQ: PAAS), Tahoe Resources, Inc. (NYSE: TAHO), and Silver Wheaton Corp (NYSE: WPM).
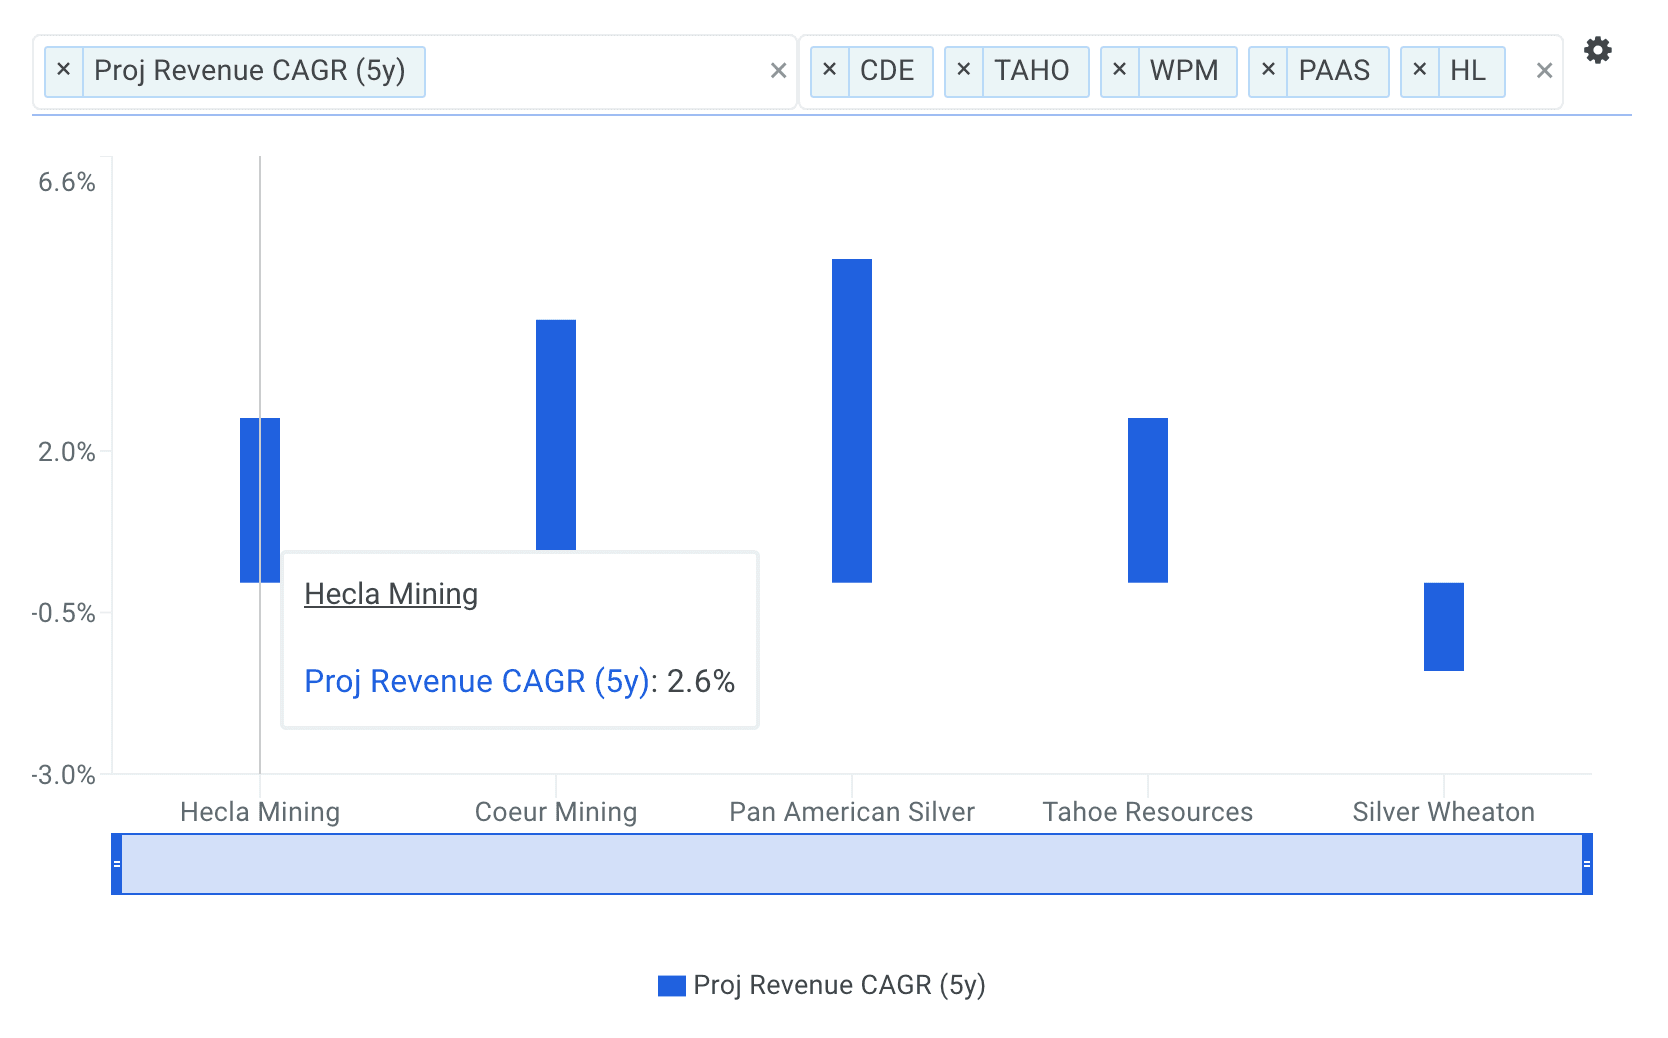
source: Benchmarks: Forecasted 5yr Revenue CAGRs
The company's projected 5-year revenue CAGR of 2.6% is only above selected comparable public company WPM (-1.4%) and below CDE (4.1%), PAAS (5.0%), TAHO (2.6%).
As highlighted below, Hecla Mining's revenue growth has ranged from -11.4% to 45.6% over the last five fiscal years.
Going forward, analysts forecast that Hecla Mining's total revenue will reach $655 million by fiscal year 2022 representing a five-year CAGR of 2.6%. However, I adjusted the forecast starting in year 2020. This brings my 2022 revenue estimate nearly $100 million higher than Wall Street's which implies an aggressive forecast.
Forecast Hecla Mining's EBITDA Profit Margin
The next step is to forecast the company’s earnings before interest, taxes, depreciation and amortization (EBITDA). Note that EBITDA is a commonly used metric in valuation models because it provides a cleaner picture of overall profitability, especially when benchmarking against comparable companies. This is because it ignores non-operating costs that can be affected by certain items such as a company’s financing decisions or political jurisdictions. For more detail, see Hecla Mining's EBITDA definition.
EBITDA margin is calculated by dividing EBITDA by revenue. The higher the EBITDA margin, the smaller the firm’s operating expenses are in relation to its revenue, which may ultimately lead to higher profit. Lower operating expenses for a given level of revenue can be a sign of internal economies of scale.
The charts below compare Hecla Mining's LTM EBITDA margin to the same peer group. The company's EBITDA margin of 32.6% is above its selected comparable public companies: CDE (27.7%), PAAS (31.2%) and and below TAHO (38.2%) and WPM (75.8%).
Hecla Mining's EBITDA margin has ranged from 14.1% to 36.6% over the last five fiscal years.
Wall Street analysts are forecasting that Hecla Mining's EBITDA margin will reach 36.9% by fiscal year 2022, representing an increase of 4.3% from its LTM EBITDA margin of 32.6%.
Although I don't specifically walk through my assumptions here, I then forecasted depreciation & amortization, capital expenditures and net working capital based on historical levels.
Calculate Free Cash Flow
With all required forecasts in place, the next step is to calculate projected free cash flow as shown below.
Step 2: Select Hecla Mining's Discount Rate
The next step is to select a discount rate to calculate the present value of the forecasted free cash flows. I used finbox.io’s Weighted Average Cost of Capital (WACC) model to help arrive at an estimate. Generally, a company’s assets are financed by either debt (debt is after tax in the formula) or equity. WACC is the average return expected by these capital providers, each weighted by respective usage. The WACC is the required return on the firm’s assets.
It’s important to note that the WACC is the appropriate discount rate to use because this analysis calculates the free cash flow available to Hecla Mining’s bondholders and common shareholders. On the other hand, the cost of equity would be the appropriate discount rate if we were calculating cash flows available only to Hecla Mining’s common shareholders (i.e., dividend discount model, equity DCF). This is commonly referred to as the difference between free cash flow to equity (FCFE) and free cash flow to the firm (FCFF). By using the WACC to discount FCFF, we are calculating total firm value. If we discounted FCFE at the required return on equity, we would end up with equity value of the firm. Equity value of the firm is simply total firm value minus the market value of debt.
I determined a reasonable WACC estimate for Hecla Mining to be 9.5% at the midpoint. An updated cost of capital analysis using real-time data can be found at finbox.io's Hecla Mining WACC Model Page. The DCF model then does the heavy lifting of calculating the discount factors by applying the mid-year convention technique.
Step 3: Estimate Hecla Mining's Terminal Value
Since it is not reasonable to expect that Hecla Mining will cease its operations at the end of the five-year forecast period, we must estimate the company’s continuing value, or terminal value. Terminal value is an important part of the DCF model because it accounts for the largest percentage of the calculated present value of the firm. If you were to exclude the terminal value, you would be excluding all the future cash flow past the horizon period. Using finbox.io, users can choose a five-year or 10-year horizon period to forecast future free cash flow.
The most generally accepted techniques to calculate a terminal value are by applying the Gordon growth approach, using an EBITDA exit multiple and using a revenue exit multiple. This analysis applies the Gordon growth formula:
As the formula suggests, we need to estimate a “perpetuity” growth rate at which we expect Hecla Mining’s free cash flows to grow forever. Most analysts suggest that a reasonable rate is typically between the historical inflation rate of 2% to 3% and the historical GDP growth rate of 4% to 5%.
Hecla Mining's free cash flows are growing at 2.0% at the end of the projection period, so I’ve selected a perpetuity growth rate of 2.0% (at the midpoint).
Step 4: Calculate Hecla Mining's Equity Value
The enterprise value previously calculated is a measure of the company’s total value. An equity waterfall is a term often used by valuation firms, referring to the trickle-down process of computing a company’s equity value from its enterprise value. Note that in the event of a bankruptcy, debt holders will be paid in full before anything is distributed to common shareholders. Therefore, we must subtract debt and other financial obligations to determine a firm’s equity value. The general formula for calculating equity value is illustrated in the figure below.
The model uses the formula shown above to calculate equity value and divides the result by the shares outstanding to compute intrinsic value per share as shown at the bottom of the figure below.
The assumptions I used in the model imply an intrinsic value per share range of $2.39 to $3.20 for Hecla Mining.
Hecla Mining's stock price currently trades at $3.60 as of March 28th, 24.2% above the midpoint value of $2.74.
Conclusion: Hecla Mining Has Downside Potential
A DCF analysis can seem complex at first, but it’s worth adding to your investment analysis toolbox since it provides the clearest view of company value.
Hecla Mining's stock has lost significant value over the last year and investors may very well decide to buy shares. However, the stock still appears to have further downside potential based on its future cash flow projections.
A DCF analysis is only one piece of the puzzle in terms of building your investment thesis, and it shouldn’t be the only analysis you use when researching a company. Finbox.io applies a number of pre-built valuation models to calculate a fair value for a given stock and uses consensus Wall Street estimates for the forecast when available. The company's average fair value of $2.78 implies -22.7% downside and is calculated from 8 separate analyses as shown in the table below.
| Analysis | Model Fair Value | Upside (Downside) |
|---|---|---|
| 10-yr DCF Revenue Exit | $2.60 | -27.7% |
| 5-yr DCF Revenue Exit | $2.88 | -20.0% |
| Peer Revenue Multiples | $2.59 | -28.1% |
| 10-yr DCF EBITDA Exit | $3.20 | -11.1% |
| 5-yr DCF EBITDA Exit | $3.82 | 6.1% |
| Peer EBITDA Multiples | $3.27 | -9.3% |
| 10-yr DCF Growth Exit | $1.98 | -44.9% |
| 5-yr DCF Growth Exit | $1.91 | -47.0% |
| Average | $2.78 | -22.7% |
Note that an updated model using real-time data can be viewed in your web browser by clicking on any of the analyses listed above.
Article by Brian Dentino, Finbox.io