
The latest price action across global equities has driven a deterioration in market breadth. The 50-day moving average breadth indicator for the 70 countries we monitor has fallen to levels last seen in the wake of the 2015/16 corrections. It was those corrections which ultimately drove the reset which created the conditions for the new bull market to commence.

The chart comes from a broader discussion on global equities in the weekly macro themes report, which aside from technicals also discussed valuations and earnings cycles.
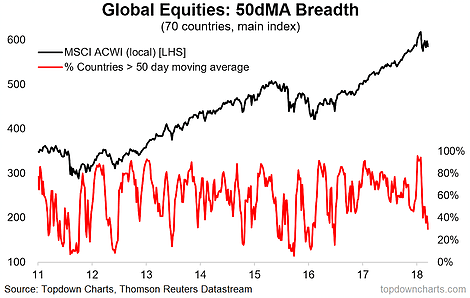
The chart in question: 50-day moving average country breadth for global equities.
On the methodology the breadth indicator simply measures the percentage of the 70 countries whose main stockmarket benchmark is trading above its respective 50-day moving average. The data is tracked on a weekly basis, and the latest readings show just 30% of countries trading above their 50-day moving average... or said differently, 49 out of 70 countries are trading *below* their 50-day moving averages.
Clearly the action in the headline MSCI ACWI belies what's going on under the surface across countries. I've previously remarked how 2018 would be more challenging as the confluence of three key themes exert their weight on global market dynamics. For reference, they are: 1. Increasing incidence of overvaluation across asset classes; 2. A maturing business cycle; and 3. The turning of the tides in global monetary policy.
The price action for 2018 YTD illustrates this new regime. Yet I've also remarked how most evidence I see still points to late-cycle not end-cycle. So given that the global earnings/economic cycle remains intact, I don't think it's time to talk seriously about a potential bear market emerging. In the mean time keep watching the charts and be mindful of risk management.
This article originally appeared as a submission at See It Market
Follow us on:
LinkedIn https://www.linkedin.com/company/topdown-charts
Twitter http://www.twitter.com/topdowncharts
Article by Callum Thomas, Top Down Charts


