
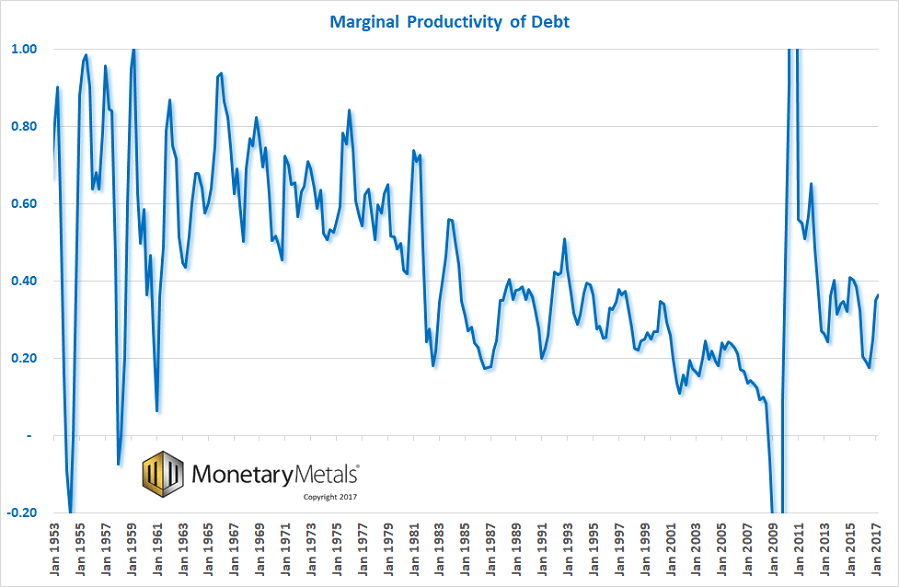
However, we can look at how much additional GDP is added for each newly-borrowed dollar. This is called marginal productivity of debt. This shows a clear picture, a secular decline over many decades. To produce this graph, take change in GDP divided by change in debt.
Check out our H2 hedge fund letters here.
I encourage you to read: Falling Productivity of Debt, Gold and Silver Report 15 Oct 2017
Last week, we discussed the ongoing fall of dividend, and especially earnings, yields. This Report is not a stock letter, and we make no stock market predictions. We talk about this phenomenon to make a different point. The discount rate has fallen to a very low level indeed.
Discount in stocks is how you assess the present-day value of earnings to occur in the future. For example, if the discount rate is 10%, then a dollar of earnings per share at Acme Piping next year is worth $0.90 today. At a 1% discount, it’s worth $0.99. As you look forward many years, the difference between these rates is very large.
A buck of earnings at 10% discount = $1.00 + $0.90 + $0.81 + $0.73 … = $10.
At 1% discount = $1.00 + $0.99 + $0.98 + $0.97 … = $100.
A rising stock price is equivalent to a falling discount rate, assuming earnings are not growing commensurately. Our graph last week shows that they aren’t.
The idea of commensurate is important in economics. Any economist can paint a rosy picture by, for example, showing rising GDP. If you object that debt is rising with GDP, the economist switches to a chart of debt/GDP. He will tell you that the solution is to grow GDP with the right fiscal and regulatory policies.
However, we can look at how much additional GDP is added for each newly-borrowed dollar. This is called marginal productivity of debt. This shows a clear picture, a secular decline over many decades. To produce this graph, take change in GDP divided by change in debt.


