
Readers often send us great questions related to different ideas on systematic value strategies. The outcome of years of back and forth with readers and internal discussions is several books and hundreds of blog posts on the subject of value investing.

Check out our H2 hedge fund letters here.
So…What have we learned?
We’ve learned a lot, but despite our best research efforts we haven’t changed our core systmeatic value model. We still follow our Quantitative Value philosophy, which we first described in 2012. We’ve also feel we are closer to identifying the real secret sauce of systematic (or non-systematic for that matter) value investing:(1)
- Buy the cheapest highest quality stocks in the market;
- Avoid diworsification;
- Prepare for relative performance pain.
These secret sauce items probably sound cliche and almost too simple. I think I know why: We typically only write about research where things have “worked,” primarily because this is the only research that gets published! This bias towards positive results in published research might cause an appearance that there are tons of great ideas out there that can create the ultimate 4+ Sharpe ratio value strategy — simply not true. We need to make this “bias towards new and exciting results” more obvious by highlighting all the things that have been tried and DO NOT work. Once one accounts for all these observations, one begins to heavily discount optimizations on old ideas that are published as “new” findings. In other words, flipping the mantra of, “there has never been a backtest you didn’t like,” on its head, and instead, showing you piss-poor backtest results.(2)
The paper below, written by a University of Chicago MBA student (at the time), tests an “intuitive” idea that frankly doesn’t work that well.
What’s the idea?
Value investors love the idea of trying to make value investing suck less (arguably impossible). One concept is to try relative value strategies that “buy (short) stocks that are below (above) their long-run historical absolute or market-relative valuation.” For example, consider stocks A and B. Stock A is selling at a P/E of 8, but has historically sold at a P/E of 5; stock B is selling at a P/E of 10, but historically trades at a P/E of 20. A straight-up value strategy would prefer A to B because the P/E of A is 8 versus the P/E of B, which is 10. However, a relative value investor would prefer B to A because B is trading “relatively” cheap to its historical P/E of 20 and A is trading relatively expensive to its historical P/E of 5.
In “The Performance of Relative-Value Equity Strategies,” by Nicholas Anderson, the author examines the performance of the relative value investment strategy and compares this to old-fashioned value investing.
Anderson examines several relative-value strategies that invest in stocks that are overvalued/undervalued relative to their own history, using scaled price-ratios.
Strategies Examined in the Paper
Anderson tests three relative value strategies:
- Z-score
- Simplified Z-score
- A Heilbrunn strategy
Z-score
Z-score measures “market relative” P/E, scaled by “market relative” P/E volatility, using the following formula:
An example will illustrate the intuition. Suppose a stock today has a P/E of 11, versus the market P/E of 15. Next, consider that historically the stock has traded at a P/E of 13, versus the market P/E of 15. Compared to its historical P/E, the stock looks cheap today. We divide the market relative PE by the market relative standard deviation.
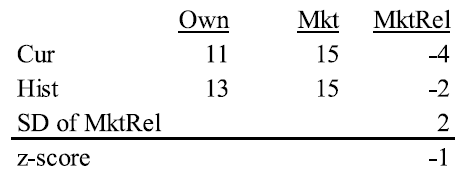
In this case, Z = (–4 – ( –2)) / 2 = –1. The stock is a buy! Note that if the stock has a very stable market relative P/E, SD is lower, sending the z-score higher.
Simplified Z-score
This is the same strategy as Z-score above, except it eliminates the denominator, thus ignoring historical volatility. Here we are just looking for stocks trading at the low end of their market relative P/Es.
Heilbrunn — Scaled Price-to-Earnings Ratios
Heilbrunn (1958) used historical dividend yield and P/E ratios to identify the best times to buy and sell. Heilbrunn suggested that investors buy when stocks were trading below their historical P/Es, and sell when stocks were trading above their historical P/Es. In this view, rather than focusing on the cheapest P/E stocks in the cross-section, investors can trade advantageously when P/Es trade at the bounds of their historical ranges.
Traditional cross-sectional P/E
As a benchmark, the author also conducts a traditional stock sort based on P/E. The idea here is to run the 3 previous relative-value strategies and see if they add value over a simple P/E strategy. These strategies are akin to the horserace studies Jack and I have done in the past.
Results from the Tests
The sample in the test includeS&P 500 stocks the period examined is 1990 to 2014. The data source is CRSP data from Compustat. For each strategy, the author forms decile portfolios, using both equal weighting and value weighting methodologies.
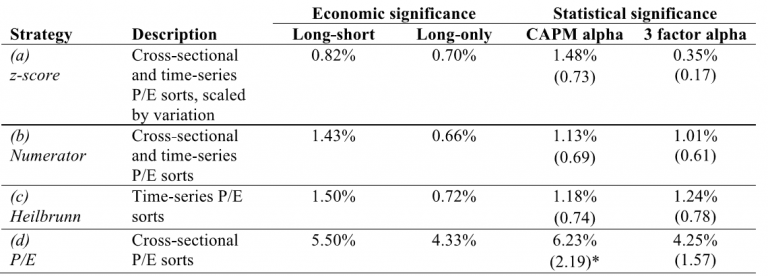
Below is a summary of the equal-weighted results:
The results are hypothetical results and are NOT an indicator of future results and do NOT represent returns that any investor actually attained. Indexes are unmanaged, do not reflect management or trading fees, and one cannot invest directly in an index.
What do you notice?
The “old-fashioned” cheap P/E approach offers the best long/short and long-only returns, by far.
In fact, as the approach simplifies, the performance improves. Moving down the strategies, we go from complex to simple, beginning with a) the whiz-bang z-score, to b) the simplified z-score, to c) Heilbrunn’s “dumb” time-series approach, and finally to d) simple P/E. As we move down the list from complex to simple, returns increase monotonically for long/short returns, and long/short returns after controlling for fama-french 3-factor exposures. All three relative value strategies offer similar long-only returns, yet are soundly beaten by simple P/E. Aside from simple P/E, none of the more complex strategies yields statistically significant excess long/short returns in CAPM or 3-factor regressions. When the author examines risk-adjusted returns, he finds P/E has the highest Sharpe ratio of 0.67, versus approximately 0.51 for the relative value strategies (which is approximately in-line with the index).
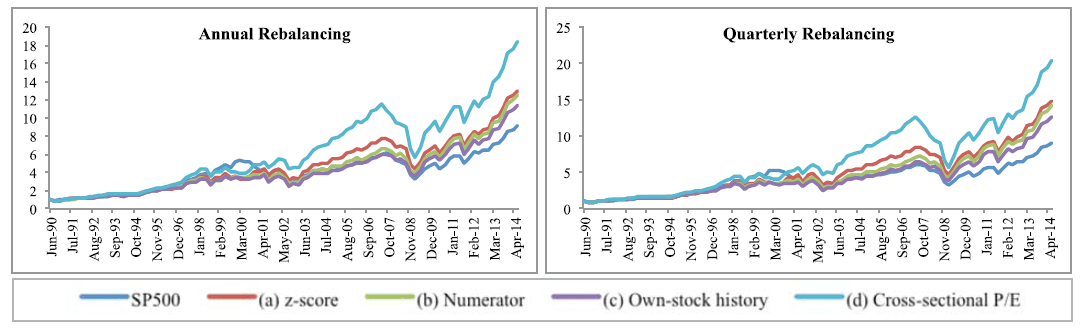
The below charts show the cumulative growth on a $1 investment in equal-weight long-only strategies, and in the SP 500 TR index, with annual and quarterly rebalancing:
The results are hypothetical results and are NOT an indicator of future results and do NOT represent returns that any investor actually attained. Indexes are unmanaged, do not reflect management or trading fees, and one cannot invest directly in an index.
The graph provides a visual representation of the outperformance of the simple P/E strategy, although the relative-value strategies do add some value over the passive index.
Of the relative-value strategies, the z-score performs best long-only, and the author also finds z-score offers some diversification benefits (see the paper for details).
Conclusion
This paper was originally conceived as a way to evaluate whether relative-value strategies are worthwhile strategies to pursue when compared with strategies associated with traditional cross-sectional stock sorts based on valuation metrics. In sum, the answer is “not really.” While relative-value strategies do seem to add value over a passive index, it appears investors would be generally better off if they relied on simple P/E-based investing. While complex relative-value strategies like z-score can offer investors a great story that they are superior to simple value strategies, the story is not always backed up by evidence.
An interesting question is “why” don’t relative value strategies work as well? One hypothesis is that the value anomaly is driven by components of risk and mispricing due to overreaction to bad news. If the relative value measure doesn’t proxy for underlying risk (and there isn’t a great economic rationale as to why it would), we shouldn’t expect it to drive excess returns. Moreover, if we believe in the mispricing story for the value premium, we would need to understand how the relative value signal proxied for hate and discontent. A first glance suggests this is a difficult story — a stock that drops from a 20 P/E to a 15 P/E may not be as loved as before, but it still might have a lot more positive market sentiment than the stock that traded at a P/E of 4 and now trades at a P/E of 6. One interesting extension would be to examine — among the cheapest of the cheap — if within that basket of hated names there is a benefit of using a relative value strategy. This would be an interesting extension to explore (and something others have already done).
The Performance of Relative-Value Equity Strategies
- Nicholas Anderson
- A version of the paper can be found here.
- Want a summary of academic papers with alpha? Check out our Academic Research Recap Category.
Abstract:
This paper examines investment strategies that combine time-series and cross-sectional stock sorts based on scaled price-to-earnings ratios, which I describe as relative-value strategies. Relative-value strategies buy (short) stocks that are below (above) their long-run historical absolute or market-relative valuation. I test the performance of relative-value strategies versus a traditional value strategy. I find that a relative-value effect exists, but is dwarfed by the traditional value effect. On average, the tested relative-value strategies deliver long-short returns of 1.25% p.a. and long-only excess returns of 0.69% p.a. over 1990 to 2014. The traditional value strategy produces long-short returns of 5.50% p.a. and long-only excess returns of 4.33% p.a. Relative-value strategies offer an alternative but not necessarily superior source of returns. I evaluate returns after adjusting for common risk factors. I explore the effect on returns from alternative portfolio formation and rebalancing rules. I discuss possible explanations for the findings and implications for investors.
- The views and opinions expressed herein are those of the author and do not necessarily reflect the views of Alpha Architect, its affiliates or its employees. Our full disclosures are available here. Definitions of common statistics used in our analysis are available here (towards the bottom).
- Join thousands of other readers and subscribe to our blog.
- This site provides NO information on our value ETFs or our momentum ETFs. Please refer to this site.
References
This assumes your goal is long-term compounding. Different constraints might change this equation (e.g., tracking error constraint).
Please send us research/papers that find “non-findings.”<
The post "Do Relative-Value Strategies Beat Traditional Systematic Value Investing Strategies?" appeared first on Alpha Architect.


