
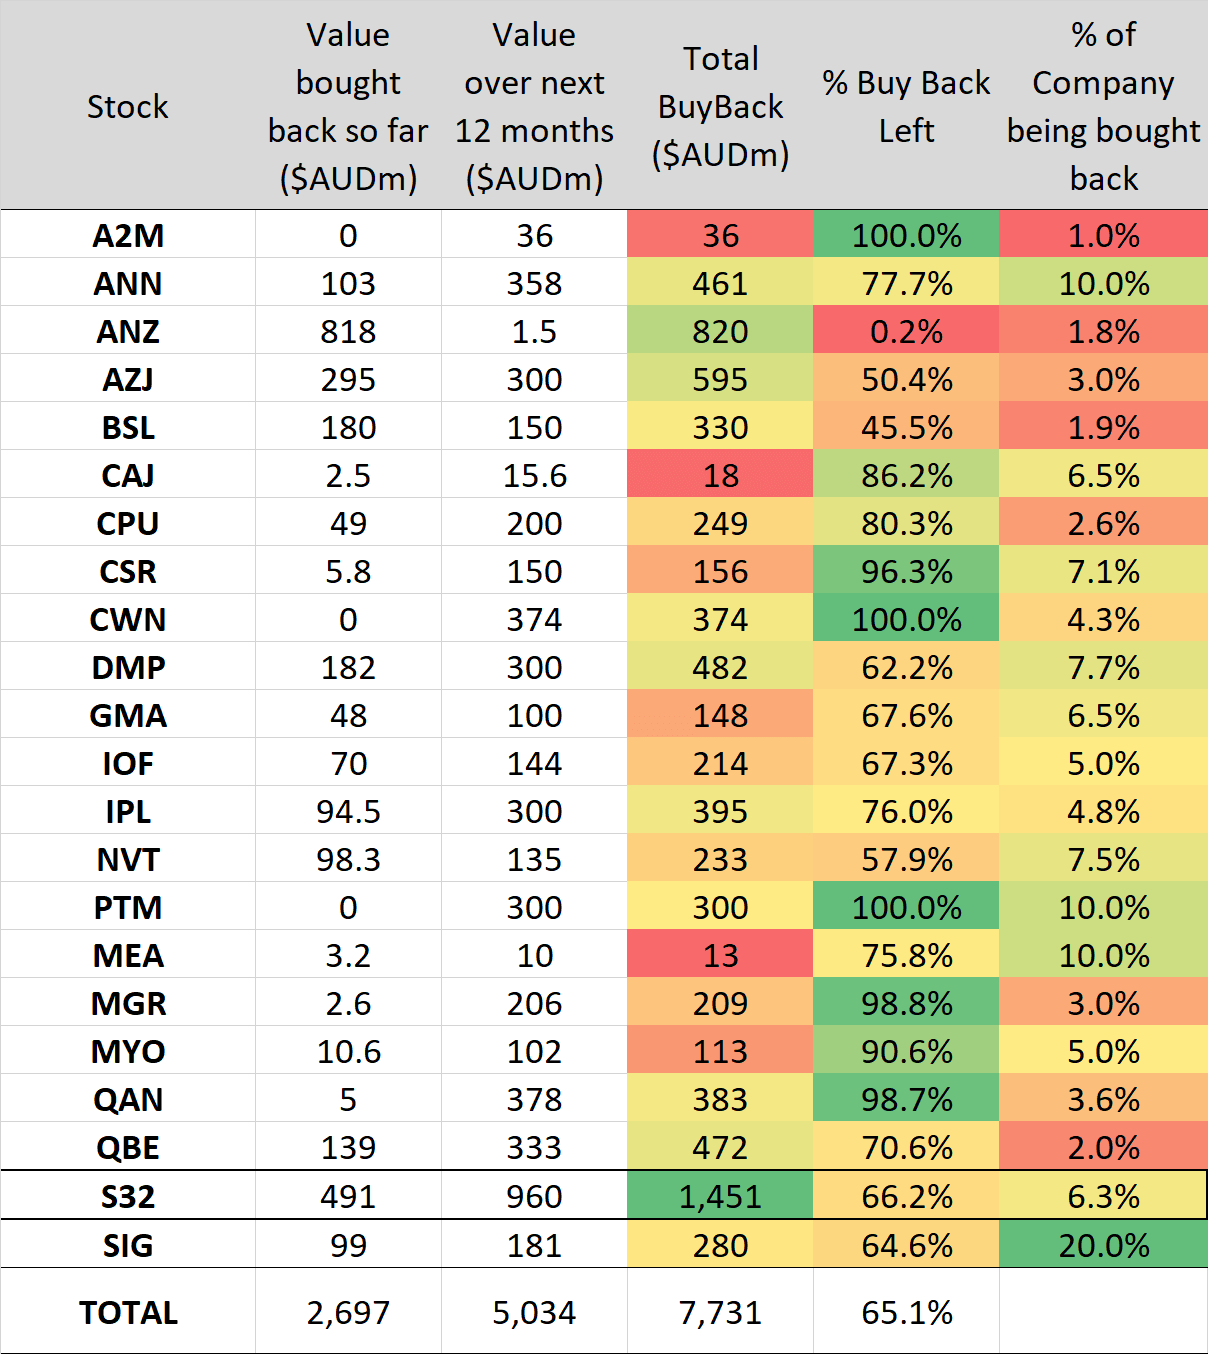
The ASX currently has 22 companies undertaking Share Buybacks, with a planned Buyback program of $7.73b.
When you step back and consider this, it is an all-time record. Yet it is only 0.41% of the Total ASX Index (Index size AU$1.88 trillion). As the table shows below what is interesting is there still remains $5.03b to buyback or 65.1% of the targeted investment to complete, ranging from $1.5m by ANZ Bank (ANZ) to $960m by South 32 (S32), a company we will discuss in more detail shortly.

Check out our H2 hedge fund letters here.
Source: ASX Announcements, Coppo
Compare this to the United States who in 2018 will spend over US$800b on Buybacks (according to J.P Morgan[1]), which is an all-time record up from US$517.7b spent in the trailing last 4 quarters, as shown below. For the SP500 the Buybacks as a % of the SP500 represents 3.3% (Index size US$24.45 trillion), which is some six times higher than the ASX. A significant gap for the ASX to catch up!
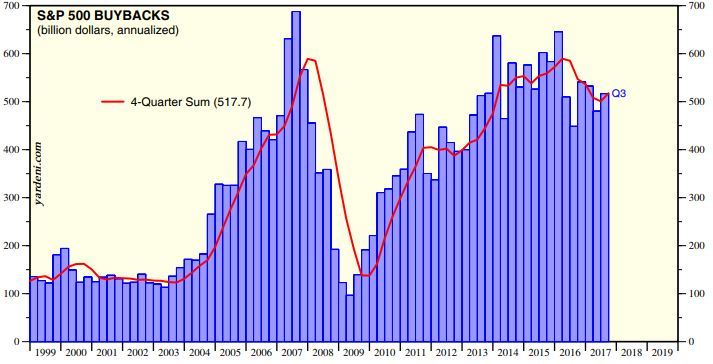
Source: Standard & Poors Corporation
Could we then say the relative underperformance YTD of the ASX in 2018 (-2.01%) to the SP500 (+2.00%) is due in part to Buybacks? Why do a Buyback? How do Buybacks provide benefits? What do the World’s Investment Masters have to say about Buybacks? When should it be done compared to intrinsic value? These are all some questions we will look to answer.
So first, let’s look at what the World’s Investment Masters have to say about BuyBacks, from without question the greatest collection of teachings and wisdom of successful investors at www.mastersinvest.com - a must read site built by an experienced 25yr Investment Banker.
Warren Buffett
“Repurchases - is sensible [allocation of capital] for a company when its shares sell at a meaningful discount to conservatively calculated intrinsic value. Indeed, disciplined repurchases are the surest way to use funds intelligently. It’s hard to go wrong when you’re buying dollar bills for 80c or less. But never forget: In repurchase decisions: price is all important. Value is destroyed when purchases are made above intrinsic value”
Mohnish Pabrai
"I look more favourably if a company is doing significant buybacks. That actually adds something to the equation for me. The dividends particularly are not of interest"
Peter Lynch
"Buying back shares is the simplest and best way a company can reward its investors. If a company has faith in its own future, then why shouldn't it invest in itself, just as the shareholders do?"
Frank Martin
"Boards that authorise share-repurchase initiatives at market prices below what the businesses are intrinsically worth per share (without foregoing investment in even more compelling growth opportunities and with due regard for the financial security of the remaining shareholders) are clearly putting the shareholder's interest high on the priority list"
The above is very compelling evidence on Buybacks. What I do believe Buffett hints at here, is that share repurchase programs are also a proxy for management discipline. Often, managers flush with cash elect to use that cash to acquire other firms or invest in new ventures that are speculative or unlikely to earn an acceptable rate of return (that is, a return above some hurdle rate—be it a fixed percentage, or the opportunity cost of capital). These sorts of reckless investments often destroy shareholder value. For example, a variety of studies have shown that between 70–90 percent of mergers fail to create value for shareholders[2]
Some of the comprehensive research papers that have been conducted on Buybacks are set out below.
The first a recent November 2017 research paper by the London Business School and AQR Management on a study of the US Russell 3000 Index from 1990 to 2017 found the following:
- Current levels of aggregate share repurchase activity for the Russell 3000 show we are not at all time high and yields are below pre-2008 levels at around 3.0%. Peak was 4.1%; and
- Academic evidence suggests that the announcement impact on returns of share repurchases 2% on average, then an annualised gain compounding of 1-2%.
- Share repurchase critics will argue that share repurchases are designed to “artificially” increase EPS. The problem it raises with this argument is that it ignores the fact that decreased cash means lower earnings, either due to less interest earned on the cash or the loss of returns from other uses of the cash.
Second, the comprehensive study by Credit Suisse comparing Buybacks and Dividends called “Disbursing Cash to Shareholder,” found:
- When surveyed, three-fourths of CFOs cite increasing EPS as an important or very important factor in the decision to buy back shares;
- Buybacks offer more flexibility than dividends because they allow the shareholder to control the timing of taxes. A shareholder can choose to hold on to her shares instead of selling them back to the company, hence deferring a tax consequence. The same shareholder who receives a dividend in a taxable account must pay taxes at that time. This is significant; and
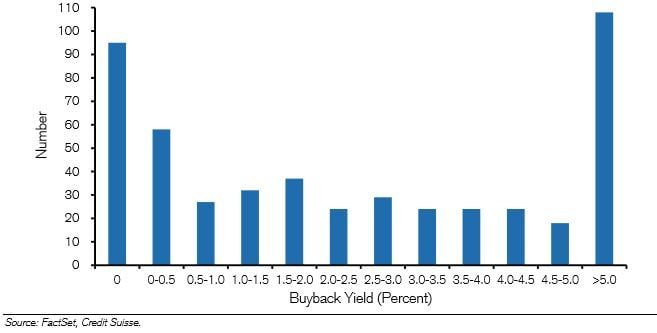
- … wait for it any companies buying back between 0-5% of their shares (which is far more common and makes up most of the dollars spent on buybacks – shown below) they don’t display nearly as strong a pattern. So, you need to find companies that BuyBack > 5%.
S&P500 Companies by Buyback Yield
And finally, O’Shaughnessy Asset Management published a detailed paper titled “The Power of Share Repurchases,” concluding:
- One of the most effective stock selection strategies in the U.S. over the past several decades has been to buy stocks that are in the midst of repurchasing significant quantities of their share;
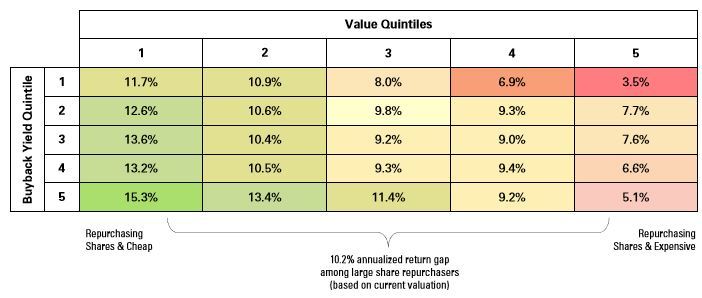
- Investors should focus on “net” buyback yield, which takes share issuance into account rather than “gross” yield which does not and only buy if the company is trading at a discount multiple. The table below shows the bottom quartile on Value (1) with the highest yield (5) generate +15.3% return compared to expensive valuation quartile (5) and low yield (1) generates +3.5% return. It is clear then that investors should avoid buying stocks trading at very expensive multiples, no matter how significant their buyback programs.
The benefits are certainly becoming very clear on a Buyback. However, I will just come back to the huge benefit of EPS accretion, as all three papers mentioned this extensively.
Let me try explain in an example on whether a buyback is accretive or dilutive to EPS. Firstly it depends on the relationship between the after-tax interest rate (either foregone from cash or incurred from debt) and the inverse of the price/earnings (P/E) multiple. Since the appropriate P/E multiple for a stock reflects factors other than the discount rate, including growth prospects and incremental return on invested capital, the accretion or dilution says little about the virtue of the program. Say a company has excess cash that is earning 3 percent and has a tax rate of 30 percent. You can calculate the “EPS breakeven P/E” with the following equation:
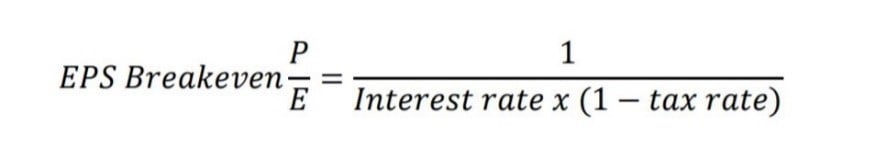
So therefore in this case the EPS breakeven P/E multiple is 48 (1/[0.03 *0.70]). This means that any buyback below a 48 P/E will add to EPS, and any buyback above 48 will subtract from EPS. Say the same company decides to fund the buyback with debt that has a pre-tax cost of six percent, the EPS breakeven P/E multiple is 24 (1/[0.06 * 0.70]). To state the obvious, with prevailing interest rates as low as they are and with P/E multiples on forward earnings near historic averages, buybacks are currently a bonanza for EPS accretion.
So, turning to the largest $ Buyback on the ASX South 32 (S32) with nearly $1.5b to Buyback lets have a look at how it stacks up. It also has the highest weight at 6.3% of total company being bought back within the Commodity space, alongside trading at a significant discount to intrinsic value, something we will show shortly. So if we use O’Shaughnessy Asset Management research, it could be argued in the top quartile of opportunities (+15.3% compound return).
However, S32 does stand out for a few additional reasons:
- Diversified miner with strong fundamentals – It is in the top 30% of all ASX listed companies on an equal weight of growth (YOY), profitability ratios (EBITDA/NPAT), and debt profile. Further commodities are at a 50yr low as we have previously outlined.
- Aluminium smelting and alumina refining assets are in the bottom half of their respective industry operating cost curves.
- The highest-quality operations are Australian manganese and Cannington silver/lead/zinc, both of which are in the lowest-cost quartile of the cost curve and have historically generated solid returns.
- Net cash positive – has surplus cash of $1.4b
- History of return on capital at 11.4% - unique for a miner
- FY17 free cash flow from operations of $1.5b, with H1FY18 free cash flow in our opinion now at the bottom of the cycle given it was hit by unique weather impacts at South Africa Coal, non-cash items that will now be cycled over and working capital to unwind in H2FY18.
- Management quality – CEO is ex CFO of BHP and Board are experienced Miners.
- For the last twelve months, analysts have been gradually revising upwards their EPS forecast for the upcoming fiscal year. UBS has FY19 fwd P/E of 10.1 and an impressive Dividend Yield of 6.2% (before franking credits) with 19.3c per share.
- The Buyback has been happening up to $3.51, yet current share price is $3.18. It is also currently 28% down from its peak share price of $4.02, only some 60 days ago.
- Trading at a super cheap x4.5 Acquirer's Multiple (a valuation tool we have written about before where <5 generates +17.8% compound returns), given Mkt Cap ($16.4b) - Cash ($1.4b) + Debt ($0b) with trailing EBITDA $3.3b.
- Ben Graham valuation of $5.31 where the formula is (V= (EPS x(8.5+2G)x4.4)/(AU Bond 15 yr Yield), which is $0.29x(8.5+8)x4.4)/3.96%, as we have added 100bp as a risk to the yield
- At a broader macro level the Money Supply growth (M1/M2) in China with +8.15% YOY support further Commodity demand and the impacts from the $5 trillion yuan Belt and Road Initiative have not yet fed through into fixed asset demand.
So, when you bring S32 back to the thinking’s of the Investment greats like Warren Buffet and whether it trades significantly below intrinsic value, it certainly has a big tick. It is also funding the Buyback through free cash flow, not debt. Mind you, re-rates for higher commodity prices are not even included in these base values.
In conclusion a powerful variable i consider is that a company must have is asymmetric information or beliefs, as well as analytical prowess, to profitability pursue a Buyback approach as company management has information that the stock price fails to reflect. It could be worth considering watching those companies with Buybacks in place. As O’Shaughnessy Asset Management research found, those with high buyback yields and trading below intrinsic value offer the best returns. Hence for us S32 is undertaking in our opinion a large and significant accretive Buyback, that will help underpin future growth for the stock price.
[1] J.P. Morgan's Long Buyback basket lists 50 stocks that it selected based on five criteria; cash held overseas; net income growth over the next two years; last 12-month buyback announcements as a percentage of market cap; last 12-month net buyback yield; market cap greater than $20 billion. The list includes Dow components Boeing Co. (BA), Coca-Cola Co.(KO), Procter & Gamble Co.(PG), Johnson & Johnson (JNJ), Citigroup Inc. (C), American Express Co. (AXP), Goldman Sachs Group Inc. (GS), Mircrosoft Corp(MSFT), Apple Inc.(AAPL), Cisco Systems Inc. (CSCO). and Intel Corp.(INTC)
https://www.morningstar.com/news/market-watch/TDJNMW_20180302618/update-sp-500-companies-expected-to-buy-back-800-billion-of-their-own-shares-this-year.html
[2] A study by KPMG International (1999) found 83 percent fail to create shareholder value, a study by Bain & Company (2004) found 70 percent fail, and a study by the Hay Group at the Sorbonne (2007) found 90 percent of mergers in Europe failed to add value
Article by Forrest Equities


