Advanced Drainage Systems Inc (NYSE: WMS) trades at an EBITDA multiple of 14.4x, which is higher than the Industrials sector median of 11.3x. While this makes WMS appear like a stock to avoid or sell if you own it, you might change your mind after gaining a better understanding of the assumptions behind the EV/EBITDA ratio. In this article, I will break down what an EBITDA multiple is, how to interpret it and what to watch out for.

How To Utilize EBITDA Multiples
A Multiples Valuation, also known as a Comparable Companies Analysis, determines the value of a subject company by benchmarking the subject's financial performance against similar public companies (Peer Group). We can infer if a company is undervalued or overvalued relative to its peers by comparing metrics like growth, profit margin, and valuation multiples.
An EBITDA Multiple, also known as Enterprise Value-to-EBITDA Multiple (EV/EBITDA), measures the dollars in Enterprise Value for each dollar of EBITDA. To determine if a company is expensive, it's far more useful to compare EV/EBITDA multiples than the absolute stock price. Furthermore, its key benefit over the P/E multiple is that it's capital structure-neutral, and, therefore, better at comparing companies with different levels of debt. The general formula behind an EBITDA Multiples valuation model is the following:
Enterprise Value = EBITDA x Selected Multiple
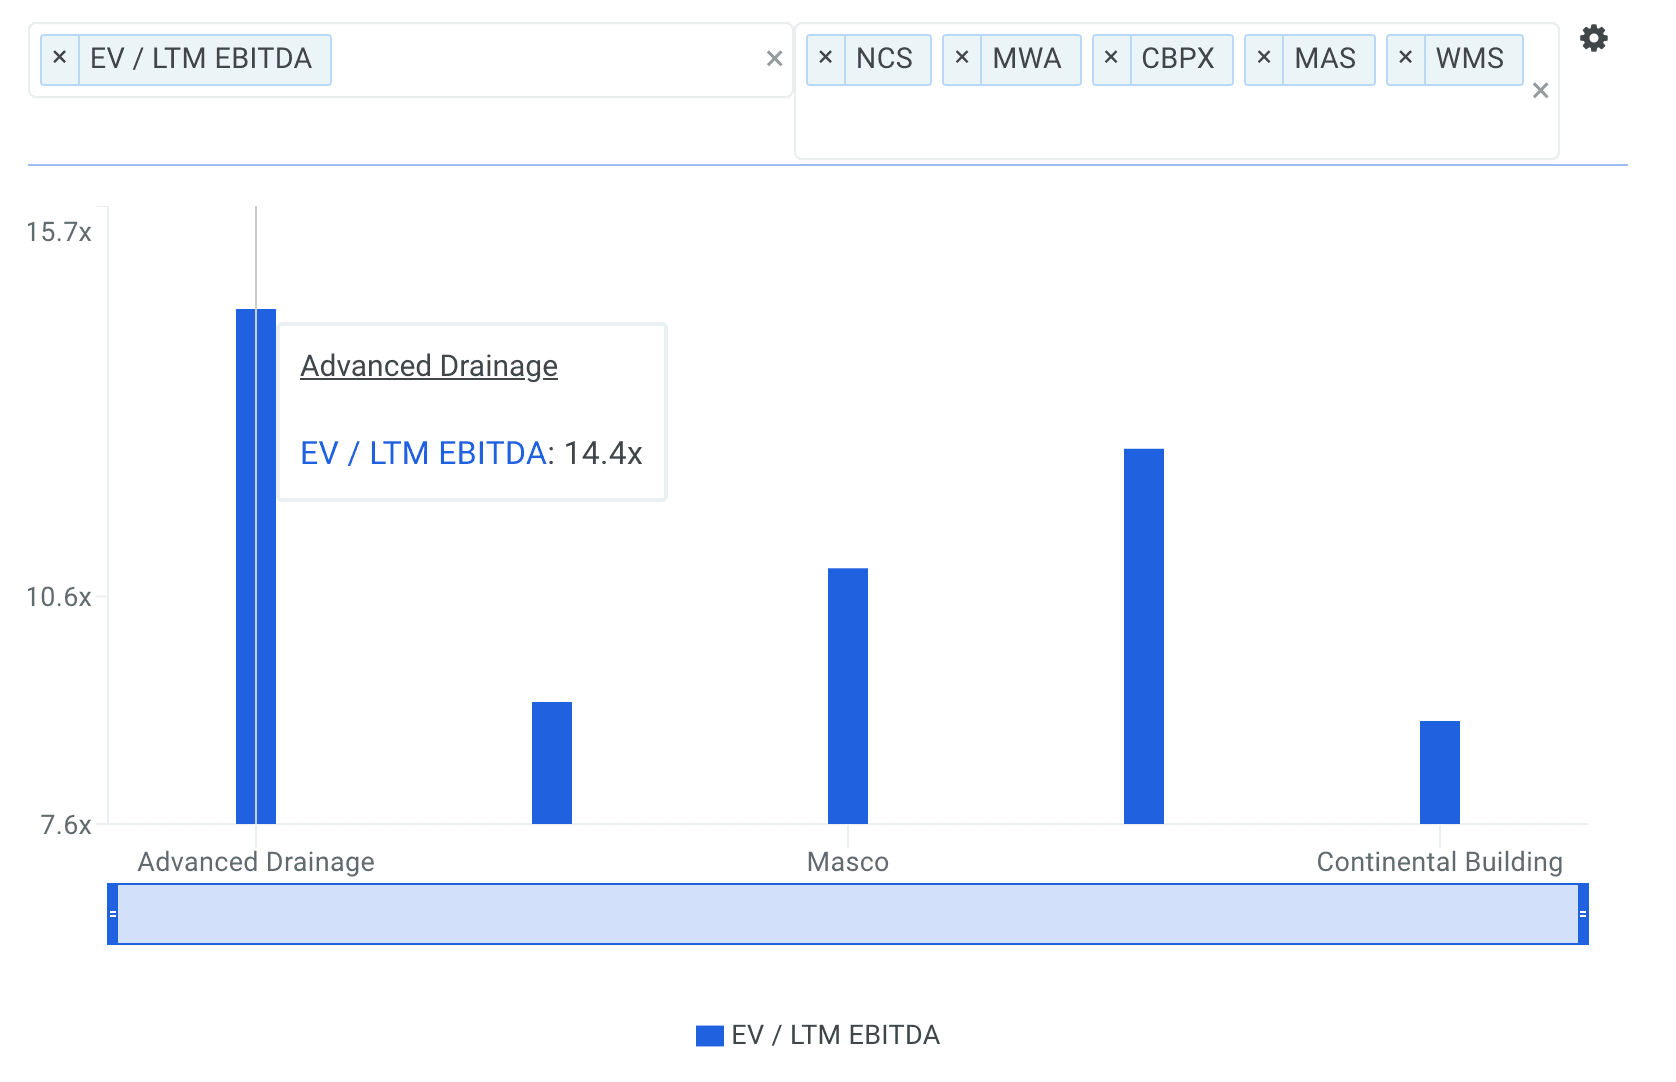
An EBITDA multiple is not meant to be viewed in isolation and is only useful when comparing it to other similar companies. Since it is expected that similar companies have similar EV/EBITDA ratios, we can come to some conclusions about the stock if the ratios are different. I compare Advanced Drainage's EBITDA multiple to those of NCI Building Systems, Inc. (NYSE: NCS), MUELLER WATER PRODUCTS (NYSE: MWA), Masco Corporation (NYSE: MAS) and Continental Building Products, Inc. (NYSE: CBPX) in the chart below.
source: finbox.io Benchmarks: EBITDA Multiples
Since Advanced Drainage's EV/EBITDA of 14.4x is higher than the median of its peers (10.1x), it means that investors are paying more than they should for each dollar of WMS's EBITDA. As such, our analysis shows that WMS represents an overvalued stock. In fact, finbox.io's EBITDA Multiples Model calculates a fair value of $18.90 per share which implies -25.2% downside.

Note that the selected multiple of 11.9x in the analysis above was determined by averaging Advanced Drainage's current EBITDA multiple with its peer group and sector.
EBITDA Multiple's Limitations
Before jumping to the conclusion that Advanced Drainage should be banished from your portfolio, it is important to understand that our conclusion rests on two important assumptions.
(1) the selected peer group actually contains companies that truly are similar to Advanced Drainage, and
(2) the selected peer group stocks are being fairly valued by the market.
If the first assumption is not accurate, the difference in EBITDA multiples could be due to a variety of factors. For example, if you accidentally compare Advanced Drainage with lower growth companies, then its EBITDA multiple would naturally be higher than its peers since investors reward high growth stocks with a higher price.
source: EBITDA multiples model
Now if the second assumption does not hold true, Advanced Drainage's higher multiple may be because firms in our peer group are being undervalued by the market.
What This Means For Investors
As a shareholder, you may have already conducted fundamental analysis on the stock so its current overvaluation could signal a potential selling opportunity to reduce your exposure to WMS. However, keep in mind the limitations of an EBITDA multiples valuation when making an investment decision. There are a variety of other fundamental factors that I have not taken into consideration in this article. If you have not done so already, I highly recommend that you complete your research on Advanced Drainage by taking a look at the following:
Risk Metrics: how is Advanced Drainage's financial health? Find out by viewing our financial leverage data metric which plots the dollars in total assets for each dollar of common equity over time.
Forecast Metrics: what is Advanced Drainage's projected EBITDA margin? Is the company expected to improve its profitability going forward? Analyze the company's projected EBITDA margin here.
Efficiency Metrics: how much free cash flow does Advanced Drainage generate as a percentage of total sales? Has it been increasing or decreasing over time? Review the firm's free cash flow margin here.
Article by Andy Pai, Finbox.io