
New form 4 filings with the SEC have revealed that Tile Shop Holdings Inc (Nasdaq: TTS) insiders have been selling large quantities of stock since last Thursday. With shares down -42.8% in the last 30 days, it’s worth taking a closer look at the company.

Check out our H2 hedge fund letters here.
Insider Buying: Tile Shop
A number of insiders have been buying shares of Tile Shop according to recent form 4 filings with the SEC. Notable insiders include Peter Kamin (Chairman of the Board), Todd Kransnow (Director) and Peter Jacullo (Director), as shown in the table below. Total insider buying has totaled $3.7 million since last Thursday which is approximately 1.3% of Tile Shop's total market capitalization.
| Insider Trading | Relationship | Date | #Shares | Value ($) |
|---|---|---|---|---|
| Peter Kamin | Chairman | Feb 26 | 58,700 | $314,632 |
| Peter Kamin | Chairman | Feb 26 | 31,300 | $167,768 |
| Peter Jacullo | Director | Feb 26 | 150,000 | $830,000 |
| Peter Kamin | Chairman | Feb 23 | 58,700 | $326,959 |
| Peter Kamin | Chairman | Feb 23 | 31,300 | $174,341 |
| Peter Jacullo | Director | Feb 23 | 97,775 | $546,151 |
| Peter Kamin | Chairman | Feb 22 | 39,132 | $219,922 |
| Peter Kamin | Chairman | Feb 22 | 20,868 | $117,278 |
| Todd Kransnow | Director | Feb 22 | 20,000 | $111,000 |
| Peter Jacullo | Director | Feb 22 | 150,000 | $875,000 |
| TOTAL | 657,775 | $3,683,051 |
Peter Jacullo (Chairman) most recently bought $830k worth of shares on Monday, February 26th. This is what propelled me to take a closer look at the company's insider activity.
Potential Reasons For Insider Activity
Tile Shop operates as a specialty retailer of manufactured and natural stone tiles, setting and maintenance materials, and related accessories in the United States. Analysts covering the stock often compare the company to a peer group that includes Lowe's Companies (NYSE: LOW), Lumber Liquidators Holdings (NYSE: LL), Home Depot (NYSE: HD) and Restoration Hardware Holdings (NYSE: RH). Analyzing Tile Shop's valuation metrics and ratios relative to its peer group offers insight into why insiders may be buying their shares.
Projected 5-year EBITDA CAGR is the average annual growth rate of EBITDA over a five year period. It's calculated as follows:
5yr CAGR = [ EBITDA FY+5 / EBITDA FY ] ^ (1/5 years) - 1
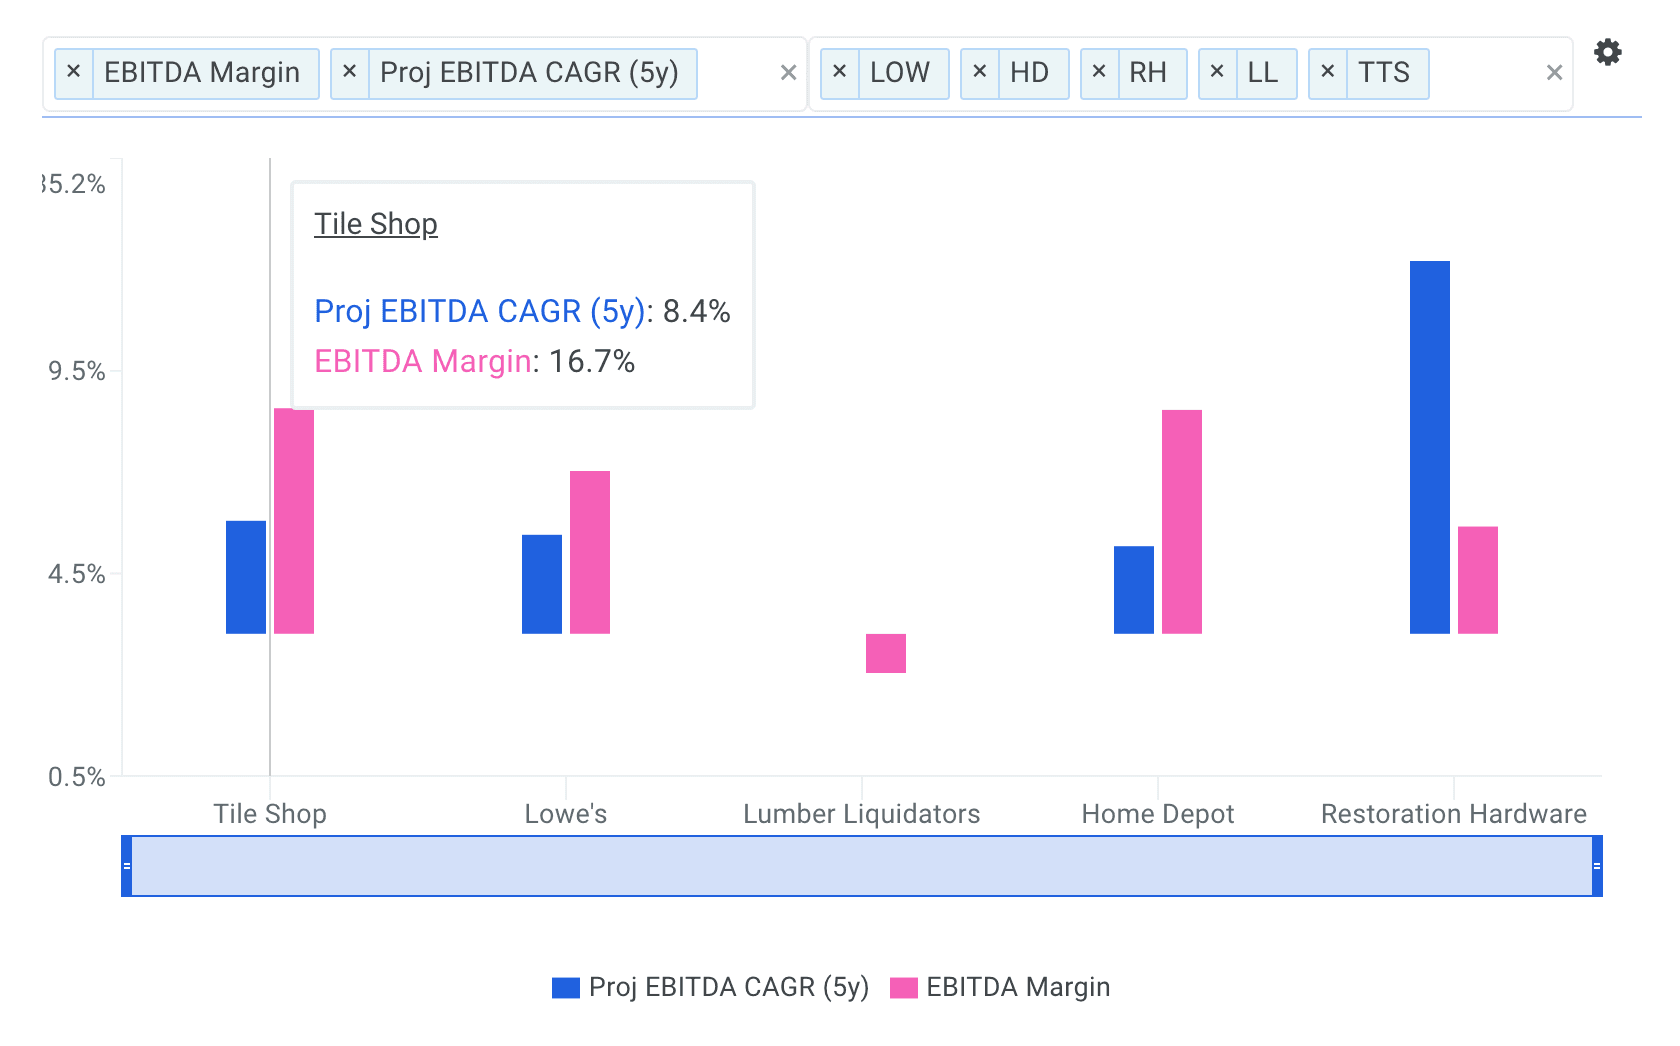
The chart below plots the five year EBITDA compounded annual growth rate for Tile Shop its peers. The company's projected 5-year EBITDA CAGR of 8.4% is above LOW (7.3%), HD (6.5%) and only below RH (27.6%). Note that LL is not meaningful.
EBITDA margin measures the portion of revenue a company converts to earnings. It is a strong measure of a company's pricing power and capital efficiency. All else equal, companies with higher EBITDA margins command higher valuation multiples. Tile Shop's EBITDA margin of 16.7% is above all of its selected comparable public companies: LOW (12.1%), LL (-2.9%), HD (16.6%) and RH (7.9%).
A company's EBITDA multiple is calculated by dividing its Enterprise Value by EBITDA and is often used to benchmark the fair market value of a company. Its key benefit over the P/E multiple is that it's capital structure-neutral, and, therefore, better at comparing companies with different levels of debt.

As illustrated in the chart above, Tile Shop's forward EBITDA multiple of 4.5x is well below all of its selected comparable public companies: LOW (11.7x), LL (26.8x), HD (14.5x) and RH (13.1x). Shares look highly attractive relative to its peers.
The company's shares last traded at $5.20 as of Monday, down -67.9% over the last year. While the stock has lost significant value, the recent insider transactions could signal a promising road ahead for shareholders.
In addition, finbox.io's average fair value estimate of $6.73 implies 29.4% upside and is calculated from 8 valuation models as shown in the table below. Each analysis uses consensus Wall Street estimates for the projections when available.
| Analysis | Model Fair Value | Upside (Downside) |
|---|---|---|
| 10-yr DCF Revenue Exit | $7.27 | 39.9% |
| 5-yr DCF Revenue Exit | $7.42 | 42.7% |
| Peer Revenue Multiples | $7.28 | 40.0% |
| 10-yr DCF Growth Exit | $6.92 | 33.0% |
| 5-yr DCF Growth Exit | $6.89 | 32.4% |
| Peer P/E Multiples | $7.45 | 43.3% |
| Dividend Discount Model | $5.65 | 8.6% |
| Dividend Discount Model (multi-stage) | $4.94 | -5.0% |
| Average | $6.73 | 29.4% |
How Should You Interpret this?
While executives are always happy to tell you all the reasons why their stock is a buy, their actions can tell a different story about the company’s future prospects. A trend of buying activity may indicate that insiders think the stock is going up over the upcoming time period, and are trying to buy before the price rises.
Keep in mind that insider activity is only one aspect of stock research and that there are other important items to consider. I recommend you continue to research Tile Shop to get a more comprehensive view of the company's fundamentals by looking at:
Risk Metrics: what is Tile Shop's asset efficiency? This ratio measures the amount of cash flow that a company generates from its assets. View the company's asset efficiency here.
Efficiency Metrics: inventory turnover is a ratio that measures the number of times a company's inventory is sold and replaced over the year. View Tile Shop's inventory turnover here.
Forecast: what is Tile Shop's projected EBITDA margin? Is the company expected to improve its profitability going forward? Analyze the company's projected EBITDA margin here.
Article by Finbox.io


