Tableau Software insiders have sold $66.6 million worth of stock since Tuesday. It’s worth taking a closer look at the company with the stock trading at such a rich valuation.

Insider Selling: Tableau Software
A number of insiders have been selling shares of Tableau Software Inc Class (NYSE: DATA) according to recent form 4 filings. Since August 9th, executives and directors have sold a total of $214.6 million worth of stock which represents 3.4% of the company's total market capitalization.
However, yesterday's form 4 filing by Pat Hanrahan (Co-Founder, Chief Scientist and Director) and Christian Chabot (Co-Founder and Chairman) notably caught my eye. The two co-founders have sold a total of $66.6 million worth of stock since Tuesday which is approximately 1.1% of Tableau Software's total market capitalization.
| Insider Trading | Relationship | Date | #Shares | Value ($) |
|---|---|---|---|---|
| Pat Hanrahan | Co-Founder, Chief Scientist and Director | Feb 07 | 200,000 | $15,713,545 |
| Pat Hanrahan | Co-Founder, Chief Scientist and Director | Feb 06 | 200,000 | $15,686,639 |
| Christian Chabot | Co-Founder and Chairman | Feb 06 | 450,000 | $35,203,943 |
| TOTAL | 850,000 | $66,604,127 |
These large trades propelled me to take a closer look at the company.
Potential Reasons For Insider Activity
Tableau Software provides business analytics software products and was founded in 2003. Management of the company reported Q4'17 earnings on February 1st that easily beat Wall Street estimates. This led to a number of equity analysts either upgrading their rating or raising their target price on the stock. Shares immediately soared and hit a two-year high.
Management obviously wants to cash in on this and take some chips off the table as highlighted by the recent selling activity. But does this signal that management is less confident in the company's future prospects?
Analysts covering the stock often compare the company to a peer group that includes ServiceNow (NYSE: NOW), Salesforce.com (NYSE: CRM), Red Hat (NYSE: RHT) and New Relic (NYSE: NEWR). Analyzing Tableau Software's valuation metrics and ratios relative to its peer group offers insight into why insiders may be selling their shares.
Projected 5-year revenue CAGR is the average annual growth rate of revenue over a five year period. It's calculated as follows:
5yr CAGR = [ Revenue FY+5 / Revenue FY ] ^ (1/5 years) - 1.
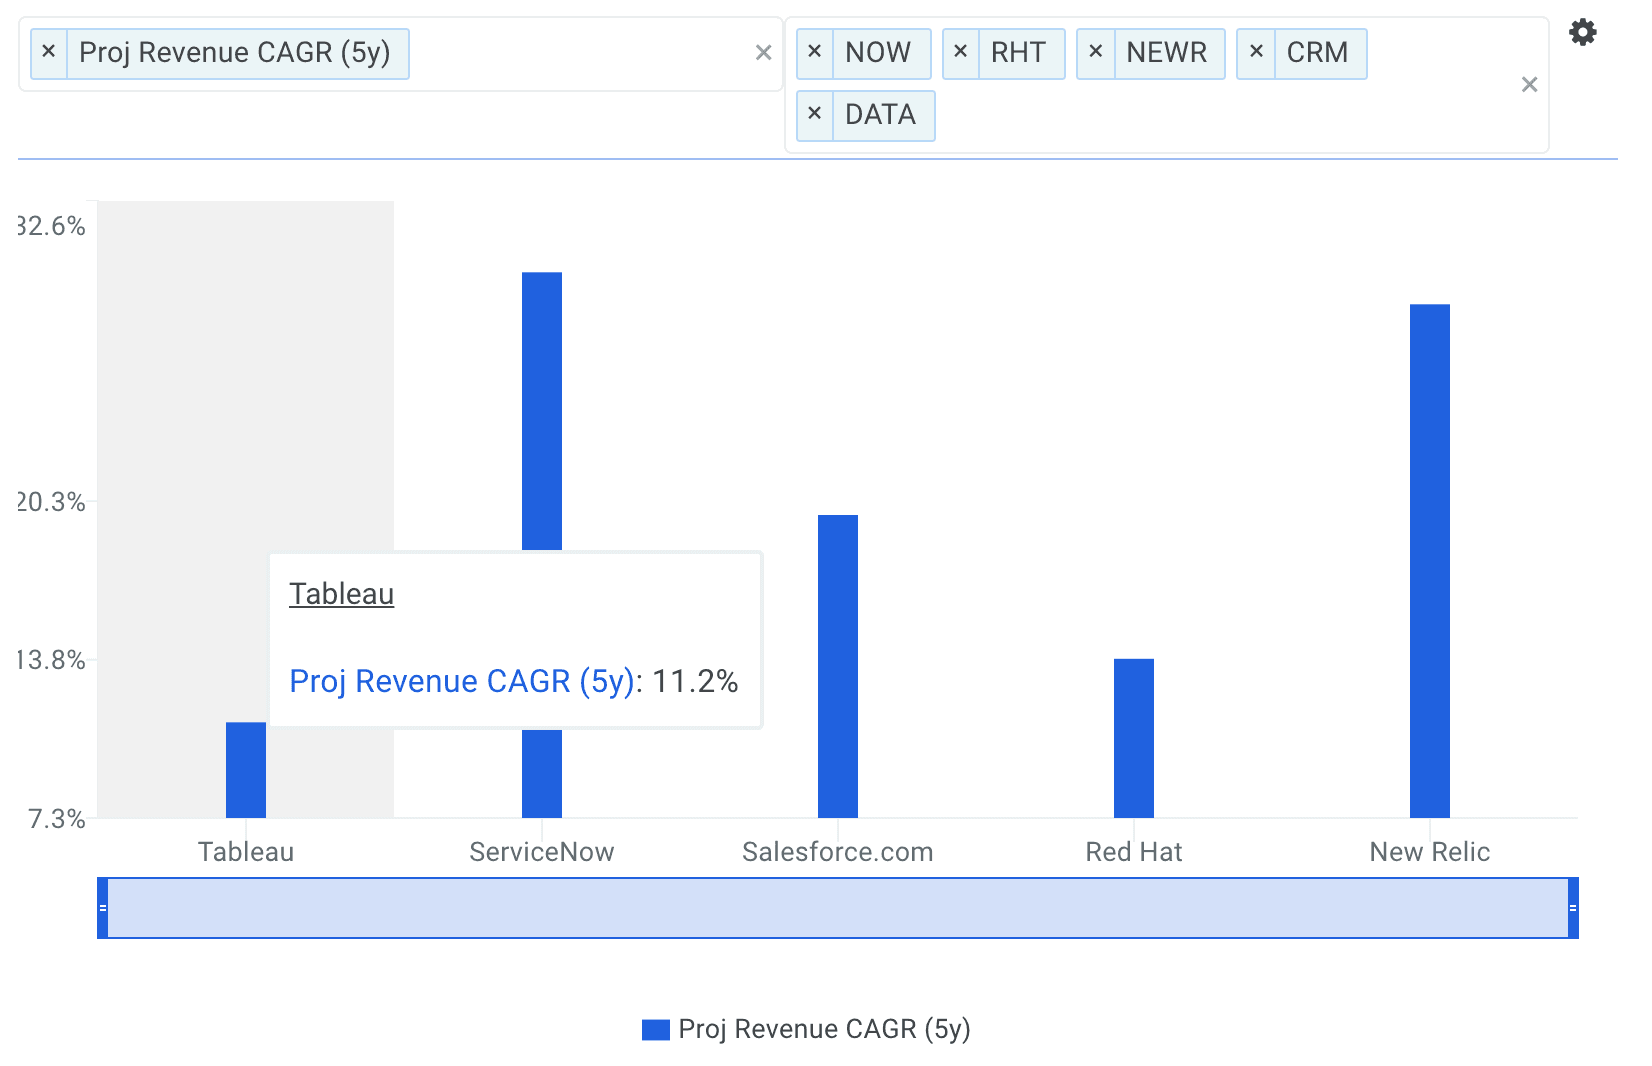
The chart below plots the five-year revenue compound annual growths for Tableau Software, and it's peers.
The company's projected 5-year revenue CAGR of 11.2% is below all of its selected comparable public companies: NOW (29.7%), CRM (19.7%), RHT (13.8%) and NEWR (28.4%).
Return on Invested Capital (ROIC) is used to evaluate the ability of a company to create value for all its stakeholders, debt and equity. Return on Assets (ROA) is another helpful metric that represents the dollars in earnings a company generates per dollar of assets. ROA is typically used to gauge the efficiency of the company and its management at deploying capital to generate income for shareholders. In general, a higher return on assets suggests management is utilizing the asset base efficiently.
Notice below the company's ROIC of -16.7% is only above NEWR (-24.1%) and below NOW (-6.7%), CRM (1.1%), and RHT (15.9%). Similarly, Tableau Software's ROA of -13.4% is again only above NEWR (-17.9%) and below NOW (-6.3%), CRM (0.1%), and RHT (7.6%).

Although the company's growth prospects and returns are less attractive than its peers, its valuation multiples trade at a premium.
The company's shares last traded at $77.75 as of Thursday, up 43.0% over the last year. While the stock has made impressive gains, the recent insider transactions could signal a troubling road ahead for shareholders.
In addition to the premium valuation multiples, finbox.io's average fair value estimate of $67.79 implies -12.8% downside and is calculated from 6 valuation models as shown in the table below. Each analysis uses consensus Wall Street estimates for the projections when available.
| Analysis | Model Fair Value | Upside (Downside) |
|---|---|---|
| 10-yr DCF Revenue Exit | $67.15 | -13.6% |
| 5-yr DCF Revenue Exit | $74.28 | -4.5% |
| Peer Revenue Multiples | $73.27 | -5.8% |
| 10-yr DCF EBITDA Exit | $77.36 | -0.5% |
| 5-yr DCF EBITDA Exit | $75.39 | -3.0% |
| 10-yr DCF Growth Exit | $39.29 | -49.5% |
| Average | $67.79 | -12.8% |
How Should You Interpret this?
While executives are always happy to tell you all the reasons why their stock is a buy, their actions can tell a different story about the company’s future prospects. A trend of selling activity may indicate that insiders think the stock is going down over the upcoming time period, and are trying to sell before the price falls.
Keep in mind that insider activity is only one aspect of stock research and that there are other important items to consider. I recommend you continue to research Tableau Software to get a more comprehensive view of the company's fundamentals by looking at:
Valuation: how much upside do shares of Tableau Software have based on Wall Street's consensus price target? Take a look at our analyst upside data explorer that compares the company's upside relative to its peers.
Forecast: what is Tableau Software's projected EBITDA margin? Is the company expected to become profitable in the near future? Analyze the company's projected EBITDA margin here.
Risk Metrics: what is Tableau Software's asset efficiency? This ratio measures the amount of cash flow that a company generates from its assets. View the company's asset efficiency here.
Article by Matt Hogan, Finbox.io