Original article on TimeMoney.com
In most older finance and economics books, you won’t see negative interest rates discussed because it seems like such an absurd concept. Why pay someone for the right to lend your money to them? This unthinkable concept became mainstream starting in 2014. Negative rates occurred because of a confluence of factors. An aging population naturally pushes rates down, the cyclical slowdown caused rates to fall, and central banks lowered the short end of the curve through rate cuts and tried to lower the long end of the curve through quantitative easing.
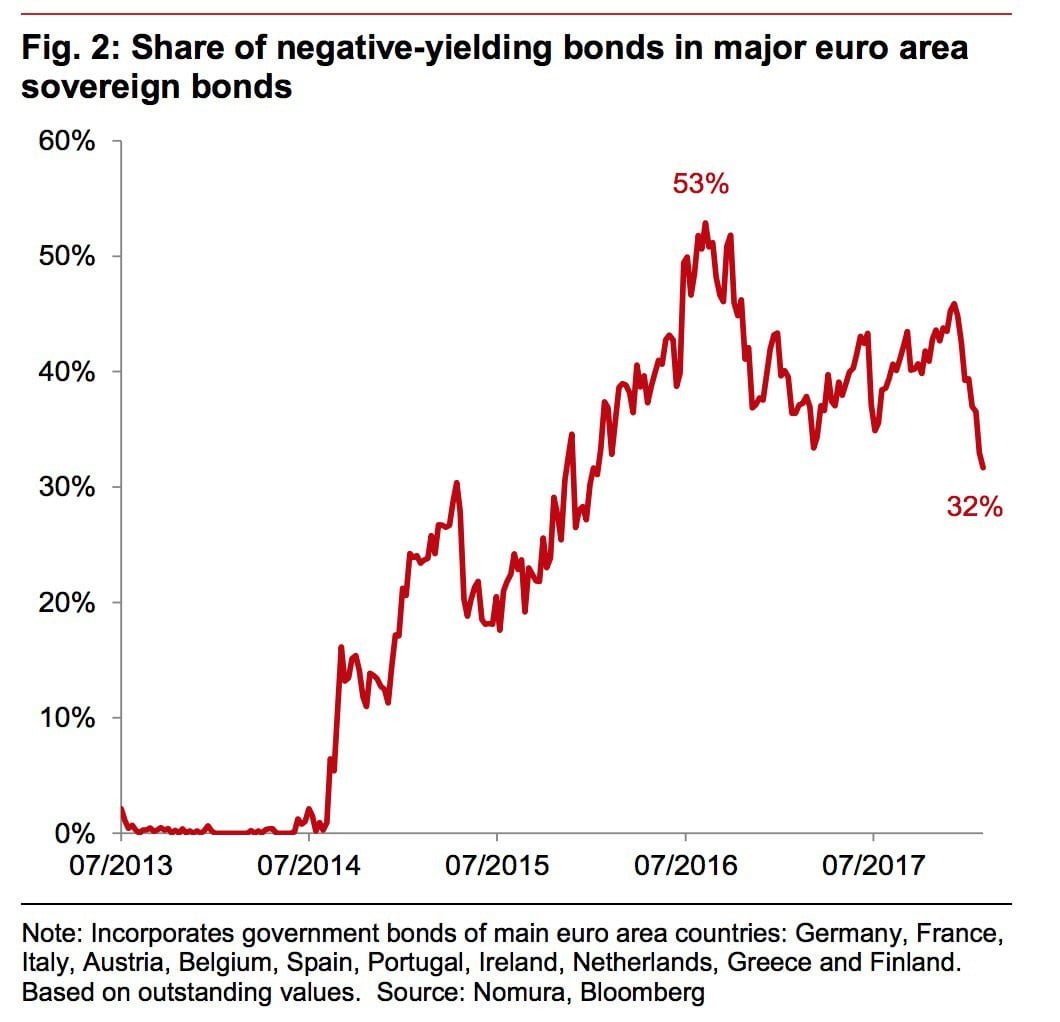
The U.S. bond market put in a peak in the summer of 2016. Ever since then rates have been rising. As you can see from the chart below, the percentage of negative yielding European sovereign bonds peaked at 53% in the summer of 2016. With the latest selloff in bonds, the percentage has fallen to 32%.
Negative Yielding Bonds Becoming Less Prominent
ECB In A Good Situation
This declining percentage of negative yielding bonds has been caused by the growth acceleration in Europe along with the tapering of the ECB’s bond buying program from €60 billion to €30 billion per month. This percentage reaching zero would be a return to normalcy, but it means governments need to pay higher yields. That could be a big problem for some of the heavily indebted nations, such as Italy which we discussed previously. So far, this hasn’t been an issue, the Greek bonds have rallied tremendously since July 2015. The yield on the 10 year Greek bond went from 14.63% to 3.73%. The E.U. is in the perfect world in that growth is improving, which gets rid of the need for monetary stimulus, while the periphery nations aren’t seeing struggles since their yields are crashing. This is the E.U.’s version of a goldilocks economy.
Even though the European economy has improved in the past few quarters, some questioned the ECB’s decision to taper QE because it still isn’t at the stated goal of 2% inflation. The January 2018 inflation rate fell from 1.4% to 1.3% which is below the target. Core inflation is at 1%. The worry amongst mainstream economists is that when the ECB takes away the stimulus, inflation will fall further below the goal. The chart below clarifies why the ECB has started to cut ties with QE despite low inflation.
ECB Sovereign Bond Holdings Nearing Their Limit
The ECB will be near its limit of owning 33% of a country’s bonds by early 2019. It is near the limit in a few countries like Germany and Portugal.
Federal Reserve Is Behind The Curve
While inflation might fall when the ECB stops QE, as many mainstream economists believe, that’s not necessarily the case. US inflation has picked up as the Fed has started to unwind its balance sheet and raised rates. At face value, it seems weird to see that since the Fed raised rates and started to unwind QE in 2017, the inflation rate increased and the financial conditions index has decreased, something that we discussed previously here and here. When the Fed is hawkish, these results don’t occur. This tells you the Fed’s latest policies aren’t hawkish enough, or stated in other words, the Fed is once again behind the curve. Everyone has an opinion on where the Fed is in the hike cycle. However, you don’t need to listen to opinions to see the truth. The breakeven inflation rate is at 2.10% which is the highest point since September 2014. The price index in the January ISM services report increased by 2 points from December to 61.9. The CPI was 2.1% in December which was up from the recent trough of -0.2% in February 2015. Monetary policy is only one part of what affects inflation and financial conditions clearly. However, as the Fed takes the punch bowl away, monetary policy should start to impact markets.
Equity Risk Premium Implies Rate Hikes Will Hurt Stocks
The question of how rate increases will affect the stock market dominates investment circles. Even after the mini stock market crash in early February, investors are still unsure of what the effects will be. To clarify, some investors think the volatility derivatives market caused the crash, some think higher inflation and rates caused it, and some think both did. There was also a heightened amount of euphoria in the market that made a correction more likely.
As you can see in the chart below, the low equity risk premium makes stocks more sensitive to rising rates.
Low Equity Risk Premium Implies High Sensitivity To Rate Increases
The stock market is the most sensitive to higher rates since 2000 when the tech bubble was at its peak. The equity risk premium is calculated by the expected returns on stocks minus the risk free interest rate. These calculations are estimates which is why this calculation can vary depending on who you ask. While this is an estimate, it’s clear that high stock multiples mean expected returns are low. Interest rates are low and if they climb, the risk premium falls. Shrinking stock multiples can cause a bear market without a recession. There can also be a large drawdown in financial markets without an economic recession. However, the reflexivity theory suggests that if there is a sizeable market correction, or an outright bear market, that this could negatively impact the economy, thereby forcing an economic recession.
Money Supply Warning Signal
The growth in the money supply often works in tune with the economy. As you can see from the chart below, the growth has fallen before each of the past 3 recessions. There was one false flag in the mid-1990s. The Austrian money supply is different from the M2 money supply because it includes treasury deposits at the Fed and excludes short time deposits, traveler’s checks, and retail money funds. As you can see from the chart below, when the Austrian money supply growth falls below the 2 year moving average of nominal GDP growth, there has always been an asset blow up of some kind.
Austrian Money Supply Warning Signal
One of the reasons this indicator might be raising red flags today is the commercial and industrial loan growth is 1.1%. That growth rate usually implies a recession is near or has recently occurred.
Conclusion
The negative rate phenomenon appears to be in the process of ending. With a push towards higher rates, stocks will likely struggle because they have a low expected return. The Austrian money supply is signaling a warning as well because its growth rate has fallen below the 2 year average of nominal GDP. The money supply growth usually falls when loan activity is weak. This checks off to be true now as the C&I lending growth is moribund. If this indicator continues to be accurate, there will be a significant decline in financial assets in the next year or two.
Disclaimer: This content is for general informational and entertainment purposes only and should not be construed as financial advice. You agree that any decision you make will be based upon an independent investigation by a certified professional. Please read full disclaimer first on TimeMoney.com.


