It might be the ultimate sign of mean reversion. After a two year run with “exceptionally low volatility (market) environment,” the S&P 500 Index (SPX-INDEX) seal has been cracked. With noticeable intraday volatility piercing through the Tuesday market panoply one day ahead on a continuing resolution regarding funding the US government, stock and volatility markets have engaged in odd gyrations. Not only is a 900 point intraday swing on the Dow Jones Industrial Average statistically unusual but so, too, is the clear lack of causation for a market event that was predicted by major bank analysts Thursday of last week.

Abnormally low volatility transforms into abnormally high volatility
Markets have enjoyed a six-year run without a sell-off exceeding 4%, Morgan Stanley’s Andrew Sheets and his team of international strategists observed in a February 6 research piece.
With the S&P 500 up every single month in 2017, an oddity matched by the rarity of a major S&P 500 sell-off of this magnitude, which Morgan Stanley notes has only occurred during 13 of the last 50 years.
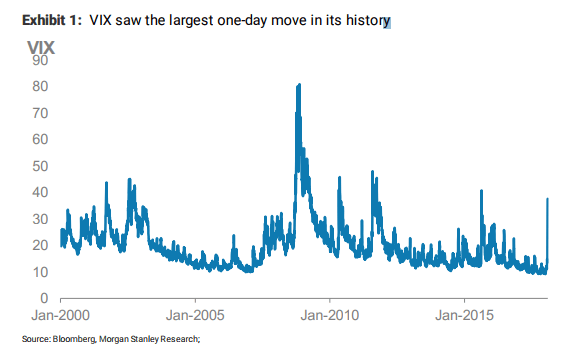
While the stock market sell-off has statistical comparisons to previous market declines on a percent basis, it is the move in volatility that is the statistical anomaly. On Monday the VIX had its largest one day move, just over 20 points. This is a statistical anomaly of a correction on several levels.
“While this reduces much of the short gamma exposure in the VIX market, it will create a negative overhang around similar but less exposed products and curtail vol supply,” Sheets wrote in a report titled “Volatility Makes a Comeback.”
“A reversal of vol from exceptionally low levels also poses a challenge to strategies that have an explicit or implicit vol target,” he said, pointing to a strategy that scales out of stocks during market declines. “Both rates and equities are at risk from deleveraging of risk parity portfolios, but equities are more exposed to a renormalisation of volatility on this move.”
Markets are functioning exactly as intended, it is market participants that drive prices
To market analyst Mark Spitznagel, president and chief investment officer at Universe Investments, there is a more stealth factor at play. Investors are experiencing a “volatility tax” that shifts wealth from one group to another.
He explains what he calls “mathematical trickery”:
Steep portfolio losses (or “crashes”) crush the long-run compound annual growth rate (CAGR) of that portfolio. It just takes too long to recover from a much lower starting point. An extreme example is losing 50% one year and then making 100% the next, with an (arithmetic) average annual return over that two-year period of +25%. That’s pretty impressive, until you consider that you’re right back where you started by the end of those two years. The volatility tax transformed what looked like an impressive return into a not-so-impressive 0% compound (or geometric) return.
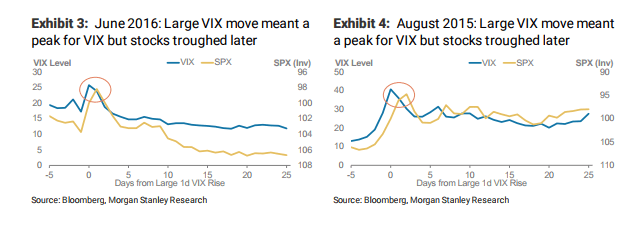
There are methods to play volatility. Morgan Stanley’s Sheets, for instance, looks at lessons learned. He notes large one-day S&P drawdowns have been historically followed by higher-than-usual returns for equities and tighter spreads for credit over the next year.
There are qualifiers, however: “In the subsequent 12 months, weakness tends to persist 3-6 months out,” so don’t expect immediate results for a buy and hold stock strategy. “Two key takeaways are that 1) risk assets can remain soft in the short term, and 2) realised volatility in months subsequent to sell-off episodes trends higher than usual, even as implied volatility drops off after initial spikes.”
Volatility isn’t going away, is the message. 2018 could be the year that volatility comes back with a vengeance. And don’t blame this on market structure. Markets have been operating exactly as they should have during this crisis.
“CME Group equity futures markets were active this afternoon as investors turned to our contracts to risk manage and hedge the largest market drop since 2011,” said Tim McCourt, global head of equities products and alternative investments at the world’s largest derivatives exchange operator. “In all instances, our markets worked as designed.”
The facts bear him out.
The E-mini S&P was down 4.4% at its lowest level around 2:10 pm. The first Market Wide Circuit Breaker level is 7% so there was no circuit breaker event in ES. The market rallied back 60 index points (2.2%) over the next 7 minutes.
E-mini Dow futures hit the 7% circuit breaker at 2:12:06 pm and then rallied 988 points (4%) over the next 7 minutes. There was no halt in trading from the circuit breaker in the Dow, but there was a Velocity Logic event during the rally back which triggered a 5 second pre-open for the Dow group (2:12:36).
The Nikkei triggered a circuit breaker (-8%) at 3:03 pm. There was a 2-minute halt (pre-open) and the market resumed trading at 3:07 pm.
All exchange functions operated exactly as they were intended. Market participants drive price action, not exchanges.


