Americans have under-saved and will need more than withdrawals from savings to survive retirement. An optimal withdrawal strategy and asset allocation, delaying Social Security, annuitizing, tapping home equity and possibly working longer need to be evaluated. Let’s take a typical American couple and evaluate which options improve retirement consumption.

The example
I used data from the BLS Consumer Expenditure Survey and the Fed’s Survey of Consumer Finances Chartbook to develop an example of a typical American retirement-age couple. This particular example is for a retiring married couple, both 65, who were earning a combined $75,000 prior to retirement and hope to spend $60,000 per year in retirement (an 80% replacement rate). They have $200,000 in savings and an un-mortgaged home also worth $200,000. Their combined Social Security at age 65, estimated using the Quick Calculator, is $27,984. They don’t have other sources of income, so they are starting out well short of their desired $60,000. (All dollar figures in this article are in real 2018 dollars unless otherwise noted. More details about the example, investment and product assumptions, and definitions of retirement outcome measures are in the Appendix.)
Initial results
Typical planning guidelines are that savings at retirement should be eight- to 12-times preretirement earnings, but here savings are a paltry 2.67-times. I’ll first test an approach where the couple goes into retirement without a real strategy, and then test strategies to improve on this base.
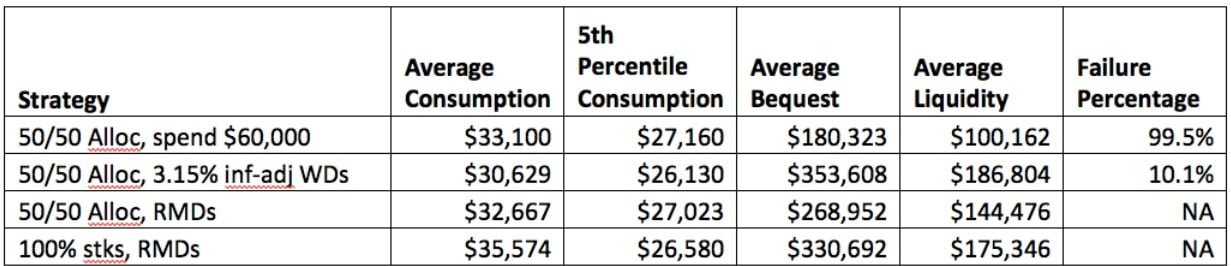
I first assume they launch into retirement by withdrawing the full difference between their Social Security and the $60,000 of desired spending, with their savings allocated 50/50 stocks/bonds. The results are shown on the first line of the chart below, and – no surprise – there are problems.
The key performance measure for this strategy is the failure percentage indicating that there is only a 0.5% chance of getting through retirement without fully depleting savings. The likely outcome is a lot of years living on Social Security only. The bequest shown is mostly the home value (which I reduce by 10% to account for costs of disposing of the property).
Next I ask how much withdrawals would need to be reduced to bring the failure percentage down to a more reasonable 10%. The answer turns out to be withdrawals of about $6,300 per year, equivalent to a 3.15% inflation-adjusted withdrawal rate. This is more conservative than the familiar 4% rule and is a reflection of my assuming lower future returns for stocks and bonds. The key result, shown on the second line of the chart, is that average consumption is only about half of the desired $60,000. The $30,629 of average consumption is less than the $27,984 of Social Security plus $6,300 of withdrawals, which reflects both the 10% of failure cases where to consumption drops to Social Security only, and reduced Social Security in years where only one member of the couple is alive.
Read the full article here by Joe Tomlinson, Advisor Perspectives


